Service Metrics
Visualize the performance of your apps and datastores.
View any service's usage metrics from its Metrics page in the Render Dashboard:

Use these metrics in combination with your service's logs to help diagnose issues as they arise.
Want to stream OpenTelemetry metrics to your observability provider?
Available metrics
Depending on your service's type, the Metrics page shows graphs for one or more of the following:
| Metric(s) | Which services? |
|---|---|
|
All services except static sites | |
|
All services with persistent storage, including:
| |
|
Web services only Some features of these graphs require a Pro workspace or higher. | |
|
All service types | |
|
CPU and memory usage
Your service's Metrics page displays CPU and memory usage in the Application Metrics section:

Use the controls at the top of the section to customize these graphs:
- If you've scaled your service, you can view metrics for all its instances, or for any subset.
- When viewing metric values for multiple instances, you can aggregate those values into a single value.
- The aggregate value can use the minimum, maximum, or average value across your selected instances.
- You can view each metric as its actual value (such as 500 MB of memory), or as a percentage of the maximum allowed value for your service's instance type.
Disk storage
The Metrics page shows disk-related metrics for the following services:
- Render Postgres databases
- Render Key Value instances
- Key Value instances only show the Disk Activity graph.
- Services with an attached persistent disk
- Web services, private services, and background workers support attaching a persistent disk.
Disk-related metrics include:
| Metric | Description |
|---|---|
|
Disk Usage |
The amount of disk space used by your service. This helps you identify when you're approaching your instance's current storage limit. |
|
Disk Activity |
The amount of data your service has read from and written to disk. Free Key Value instances don't display this metric, because they don't persist data to disk. |
|
Disk Operations |
The number of read and write operations your service has performed on its disk. |
HTTP requests
Certain features of HTTP request metrics require a Pro plan or higher.
For details, see the pricing page.
The Metrics page for a web service shows graphs for HTTP request volume and response latency in the Network Metrics section.
Note that these graphs show metrics only for requests from the public internet—they don't include requests over your private network.
Request volume
The Total Requests graph shows your web service's HTTP request volume over your selected time range:

Use the controls at the top of the section to customize this graph:
- You can filter the graph to include only requests that returned a particular HTTP status code.
- You can group each bar in the graph by the HTTP status code returned for those requests.
- Both of these controls can help you identify time periods that had a high error rate.
Teams can perform additional customizations:
- Teams can filter the graph to include only requests that were sent to a particular host (i.e., domain) or path.
- Teams can group each bar in the graph by which host each request was sent to.
Response latency
Response latency metrics require a Pro plan or higher.
For details, see the pricing page.
The Response Times graph shows your web service's response latency for common helpful percentiles (p50, p75, p90, and p99):

Click the Percentile dropdown to display only a specific percentile.
Outbound bandwidth
The Metrics page shows your service's recent outbound bandwidth usage under the Network Metrics section:
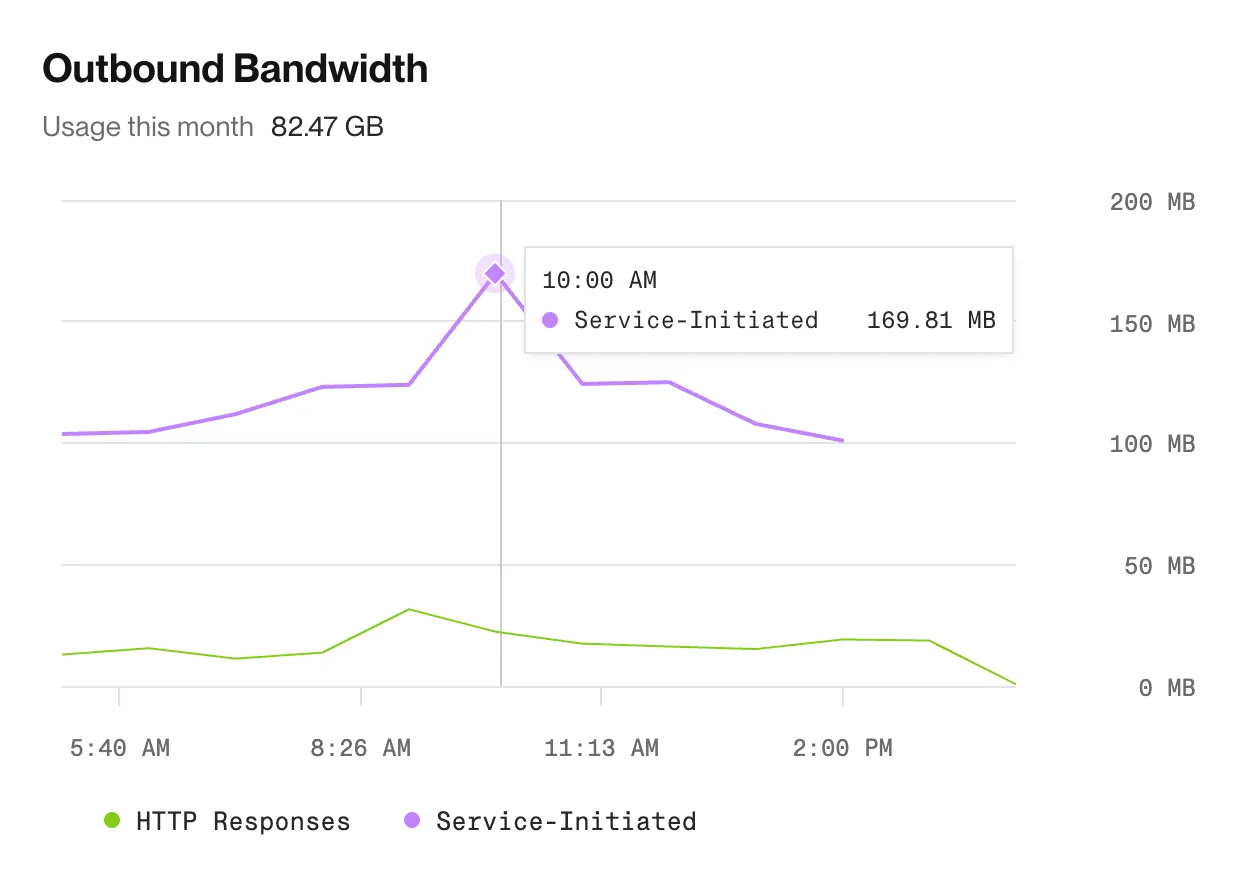
This graph displays up to four categories of outbound bandwidth, depending on your service's type and its recent network activity:
| Category | Description |
|---|---|
|
HTTP Responses |
Web services and static sites only (other service types can't receive HTTP requests over the public internet) Your service's responses to HTTP requests initiated by browsers and other clients over the public internet. |
|
WebSocket Responses |
Web services only (other service types can't receive WebSocket connections over the public internet) Your service's responses to WebSocket connections initiated by browsers and other clients over the public internet. |
|
Service-Initiated |
All service types. Traffic initiated by your service to any destination over the public internet (e.g., connecting to a third-party API). Includes all protocols (HTTP, WebSocket, etc.). |
|
Service-Initiated (Private Link) |
All service types. Traffic initiated by your service to any destination over a private link connection. Includes all protocols (HTTP, WebSocket, etc.). |
Note the following:
- This graph's resolution is fixed at one data point per hour. Each point represents the amount of outbound bandwidth used during the previous hour.
- Each new data point becomes available approximately 60 minutes after its measurement window ends.
- This graph might display very small data point values (less than 1 MB) as 0.
- You can customize this graph's time range, but it doesn't support any other filters.
Database activity
The Metrics page for a Render Postgres database includes the following database-specific metrics:
| Metric | Description |
|---|---|
|
Active Connections |
The number of open connections to your database from all connecting clients. This graph is also available for Render Key Value instances. |
|
Network Activity |
The amount of data your database has read from and written to the network. |
|
Transaction Volume |
The number of transactions executed by your database. |
|
Replication Lag |
The amount of time your primary database takes to sync changes to any read replicas. This graph appears only if your database has at least one read replica. |
|
Lock-Delayed Queries |
The number of recently completed database queries that were delayed by another operation holding a lock for one second or longer. Queries appear on this graph after they've completed. They do not appear while they're still waiting on a lock. |
|
Running Processes |
Click the Queries tab at the top of your database's Metrics page to view a table of processes that are currently running on your database. Most of these processes correspond to a client connection. Processes with the status |
|
Top Queries |
Click the Queries tab at the top of your database's Metrics page to view a table of the queries that have been executed most frequently on your database. |
Metrics retention period
Your metrics retention period depends on your workspace's plan:
| Plan | Retention period |
|---|---|
|
Hobby | 7 days |
|
Pro | 14 days |
|
Scale / Enterprise | 30 days |