Integrating Render with Datadog
Datadog is an observability platform for cloud-scale applications. You can integrate your Render services and databases with Datadog to enable fine-tuned metrics, monitoring, and automated alerting.
Although core Postgres metrics are available in the Render Dashboard, integrating with Datadog can provide more detailed metrics about the Postgres instance host environment. You can also use Datadog as a centralized location for dashboards and automated alerts.
Getting started
Sign up for a Datadog account if you don't already have one. Then, create or retrieve an API key from your Datadog organization settings page:
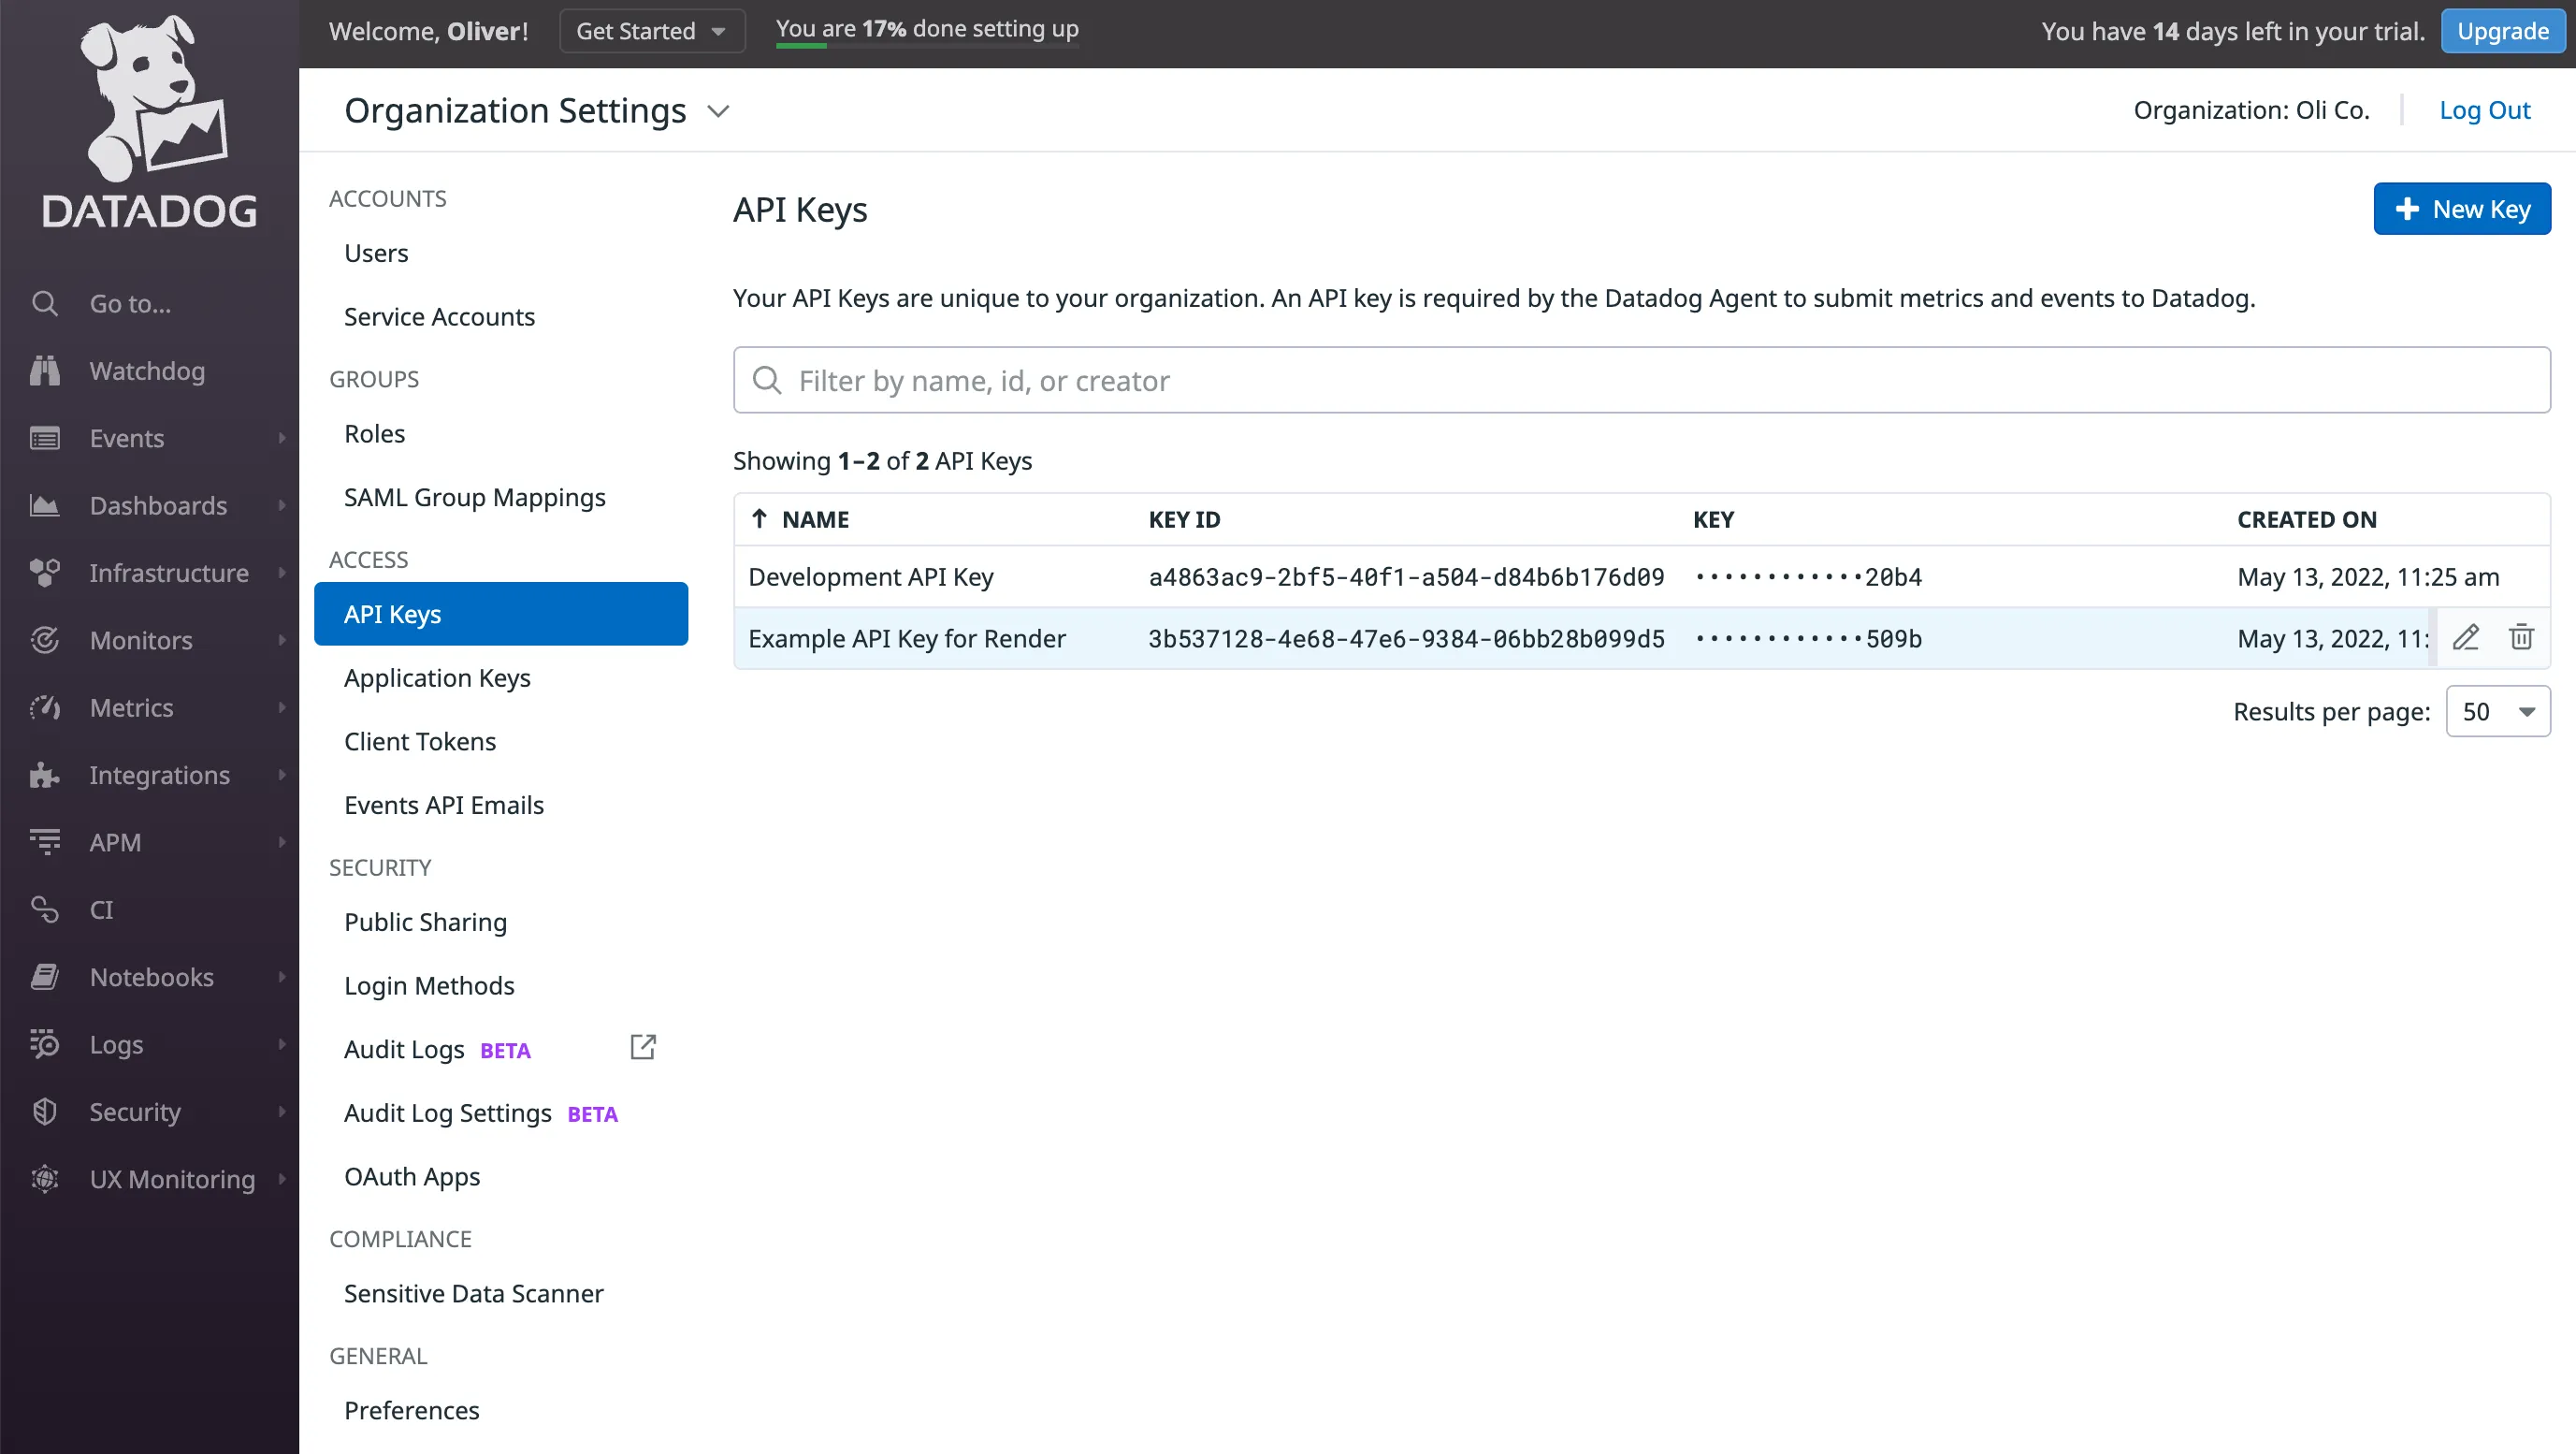
Make sure to create an API key for your organization. The Datadog integration doesn't support using an application key or a user-scoped API key.
You can confirm that you've correctly generated an API key by calling Datadog's validate endpoint with your key.
Setting up Postgres monitoring
Adding an API key enables a Datadog agent to run alongside your Render Postgres instance and report metrics to your Datadog account. All metrics reported by the agent are native to the Datadog platform, so you aren't billed for custom metrics.
Render currently supports only the Datadog sites US1, US3, US5, and EU1. Postgres monitoring is not supported with other Datadog sites (such as AP1, AP2, and US1-FED).
For new databases
While creating a Postgres database, provide your Datadog API key in the corresponding field:

For existing databases
Add your Datadog API key from the Info tab of your database's page on the Render Dashboard (in the General section, click Add Datadog API Key).
This requires a restart of your Postgres instance, which causes brief downtime.

Available metrics
Render fully supports all of the following Datadog integrations (see the linked documentation for metrics details):
| Integration | Description |
|---|---|
| Postgres | Metrics related to your PostgreSQL instance |
| Disk | Metrics related to disk usage and IO for your Postgres volume |
| Network | Metrics related to TCP/IP network stats of instance |
In addition, Render reports the following metrics:
| Metric | Description |
|---|---|
system.cpu.num_cores | The number of CPUs, as chosen by your database instance type |
system.cpu.system | The percentage of time the CPU spent running the kernel |
system.cpu.user | The percentage of time the CPU spent running user space processes |
system.mem.free | The amount of free RAM |
system.mem.total | The total amount of physical RAM, as chosen by your database instance type |
system.mem.used | The amount of RAM in use |
Viewing metrics in Datadog
You can view reported metrics from any Datadog dashboard or metrics explorer page. You can filter metrics by the database-id tag equal to your Render Postgres database ID.

Streaming service logs and metrics
You can use Datadog as your observability provider for Render log streams and metrics streams. This enables you to inspect logs and metrics from your Render services directly in your Datadog dashboard.
Stream logs
Use HTTPS to stream logs to Datadog.
Datadog has deprecated TCP log forwarding. If you previously configured a Datadog syslog endpoint (such as intake.logs.datadoghq.com:10516), replace it with the appropriate HTTPS endpoint from the table below.
To set up log streams, follow the general setup steps, then enter the following values:
-
Log Endpoint: The HTTPS intake URL for your Datadog site:
Datadog Site Log Endpoint US1
https://http-intake.logs.datadoghq.com/api/v2/logsUS3
https://http-intake.logs.us3.datadoghq.com/api/v2/logsUS5
https://http-intake.logs.us5.datadoghq.com/api/v2/logsEU1
https://http-intake.logs.datadoghq.eu/api/v2/logsAP1
https://http-intake.logs.ap1.datadoghq.com/api/v2/logsUS1-FED
https://http-intake.logs.ddog-gov.com/api/v2/logs -
Token: Your organization-level Datadog API key.
Render sends logs to Datadog as JSON array payloads, for example:
Stream metrics
For metrics streams, follow the general metrics stream setup and provide your organization-level Datadog API key and your Datadog site.