Streaming Render Service Metrics
Push metrics for CPU, memory, and more to your OTel-compatible provider.
Workspaces with a Pro plan or higher can push a variety of service metrics (memory usage, disk capacity, etc.) to an OpenTelemetry-compatible observability provider, such as New Relic, Honeycomb, or Grafana.

Metrics streaming traffic does not count against your workspace's outbound bandwidth usage.
Render does not emit metrics for the following:
General setup
The following steps must be performed by a workspace admin:
-
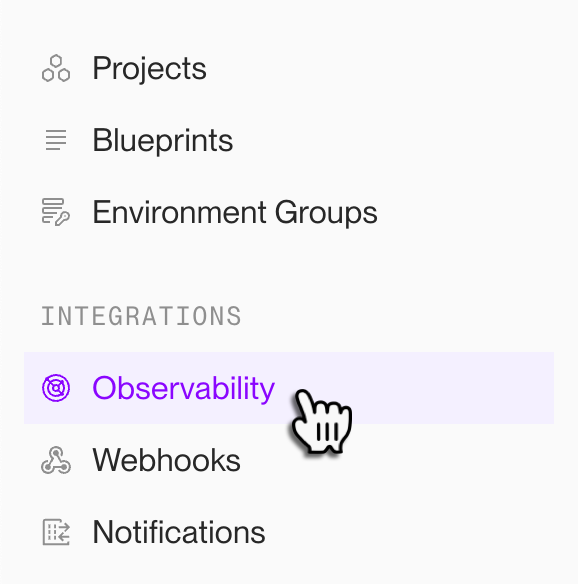
From your workspace's home in the Render Dashboard, select Observability in the left sidebar:
-
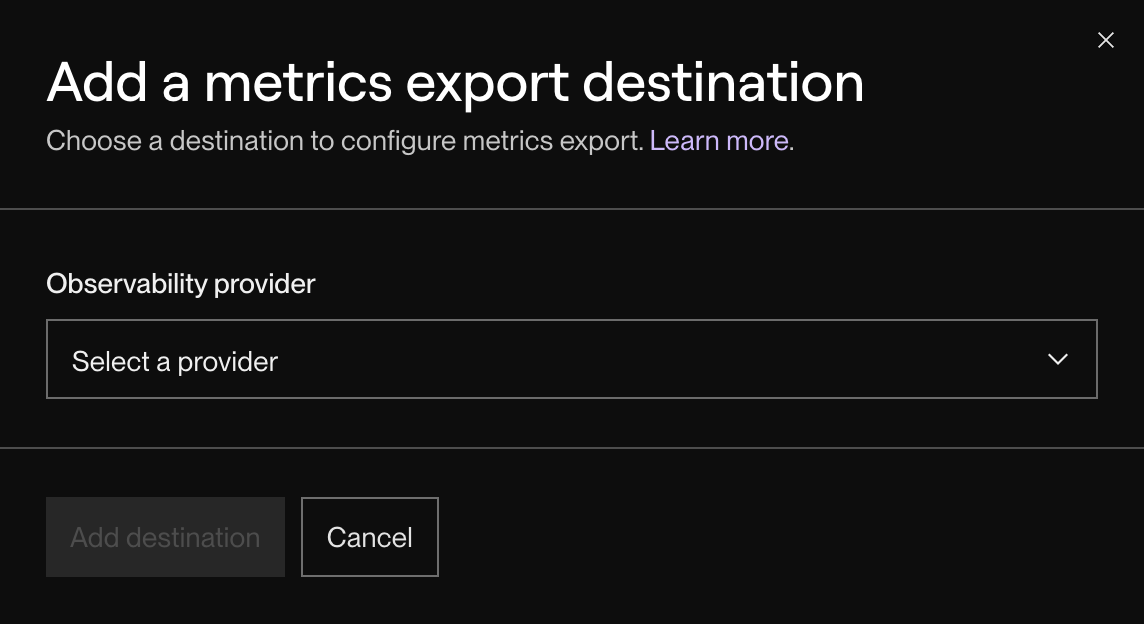
Under Metrics Stream, click + Add destination.
The following dialog appears:
-
Select your observability provider from the dropdown. The dialog updates to display fields specific to your provider.
If your provider isn't listed, select Custom. Learn how to connect a custom provider.
-
Fill in the provider-specific fields.
- See instructions for your provider below.
-
Click Add destination.


You're all set! Your provider will start receiving reported metrics from Render shortly.
Provider-specific config
When creating a metrics stream for your workspace, you provide different information depending on your observability provider:

See details for each supported provider below, along with instructions for other providers. Please also consult your provider's documentation for additional information.
If there’s a provider you’d like us to add to this list, please submit a feature request.
Better Stack
Obtain both your Ingesting host and Source token with the following steps:
-
From your Telemetry > Sources page in Better Stack, click Connect source.
-
Add a descriptive Name (e.g., "Render Metrics Integration").
-
Select Logs & Metrics, then choose Render as the Platform.
-
Click Connect source.
Better Stack creates the new source and redirects you to its details page.
-
Copy your source's Ingesting host URL and Source token.
Datadog
To simplify metrics ingestion with Datadog, Render pushes metrics in Datadog's native format instead of using OpenTelemetry.
Specify your Datadog site, according to where your Datadog data is hosted.
For API key, generate a new organization-level API key from your organization settings page. You cannot use an application key or a user-scoped API key.
Grafana
Obtain both your Endpoint and API Token with the following steps:
-
From your Grafana Cloud Portal (
grafana.com/orgs/[your-org-name]), click Details for the Grafana stack you want to use: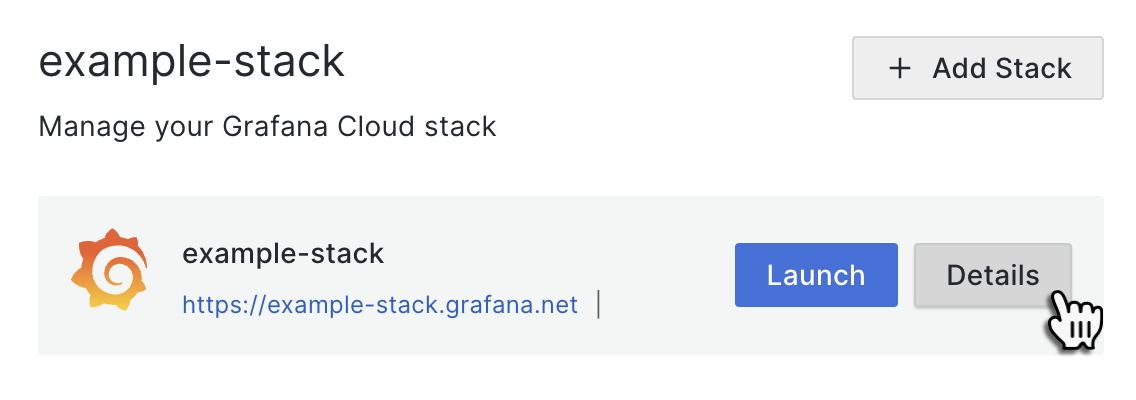
-
Find the OpenTelemetry tile and click Configure.
-
Copy the value of Endpoint for sending OTLP signals (this is your Endpoint).
-
Under Password / API Token, click Generate now.
-
Add a token name (e.g.,
render_metrics_integration). -
Click Create Token.
-
Copy the generated value starting with
glc_(this is your API Token).

For more details, see the Grafana documentation.
Groundcover
Obtain both your Groundcover Endpoint and API key with the following steps:
-
From your Groundcover dashboard, select Settings > Access > Ingestion Keys in the sidebar.
-
Click Create key.
-
For Key type, select Third Party.
Each ingestion key should be dedicated to a single data source for better security and manageability.
-
Add a descriptive name (e.g., "Render Metrics Integration").
-
Click Create.
-
Copy your Ingestion key and provide it as your API key in the Render Dashboard.
-
Copy your Managed OpenTelemetry endpoint URL and provide it as your Endpoint in the Render Dashboard.
For more details, see the Groundcover documentation.
Honeycomb
For Region, select US or EU according to where your Honeycomb data is hosted.
For API key, create a new key with the following steps:
-
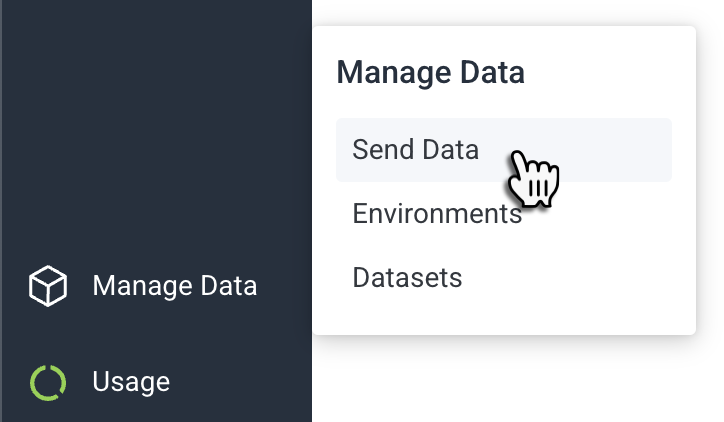
In your Honeycomb dashboard, hover over Manage Data on the bottom left and click Send Data:
-
Click Manage API keys.
-
Click Create Ingest API Key.
The following dialog appears:
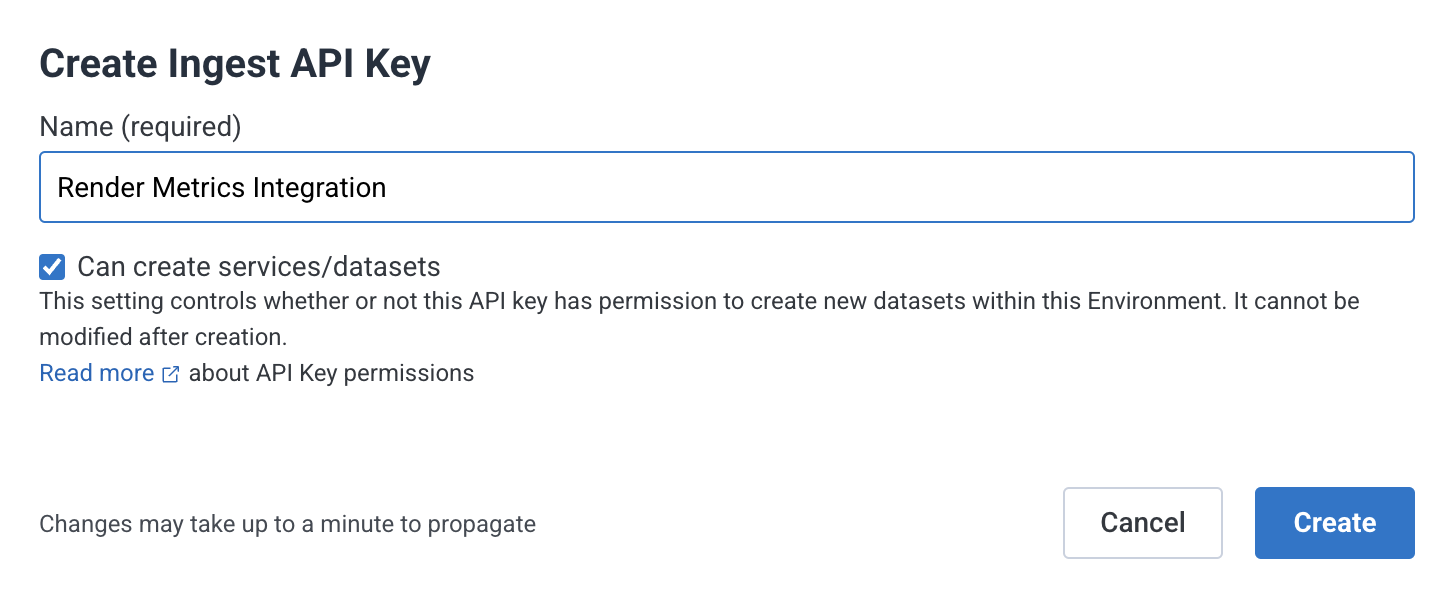
-
Add a descriptive Name (e.g., "Render Metrics Integration").
-
Make sure Can create services/datasets is enabled.
-
Click Create.


New Relic
For Region, select US or EU according to where your New Relic data is hosted.
For License key, create a new key with the following steps:
-
From your New Relic API keys page, click Create a key.
The following dialog appears:
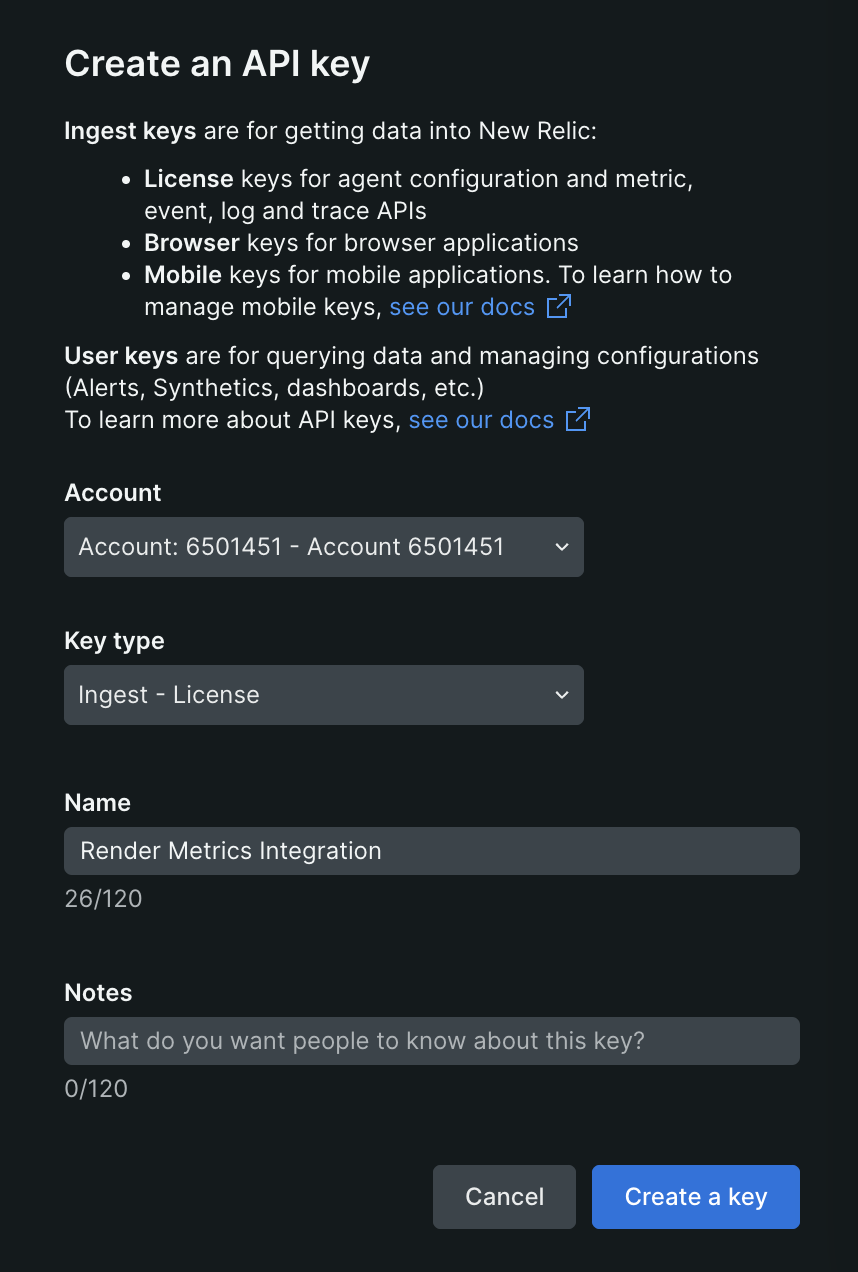
-
For the Key type, select Ingest - License.
-
Add a descriptive Name (e.g., "Render Metrics Integration").
-
Click Create Key.

Pydantic Logfire
For Endpoint, select the US region.
Render currently supports only the US region for Logfire.
Obtain your Logfire Write token by doing the following:
- From your Logfire dashboard, select your project.
- Select Settings > Write tokens in the sidebar.
- Click New write token and provide a name.
- Click Create token and copy the token. Provide it as your Write token in the Render Dashboard.
For more details, see the Logfire documentation.
Signoz
Obtain both your Signoz Endpoint and Ingestion key with the following steps:
-
From your Signoz Cloud dashboard, select Settings > Workspace Settings in the left sidebar.
-
Switch to the Ingestion tab:
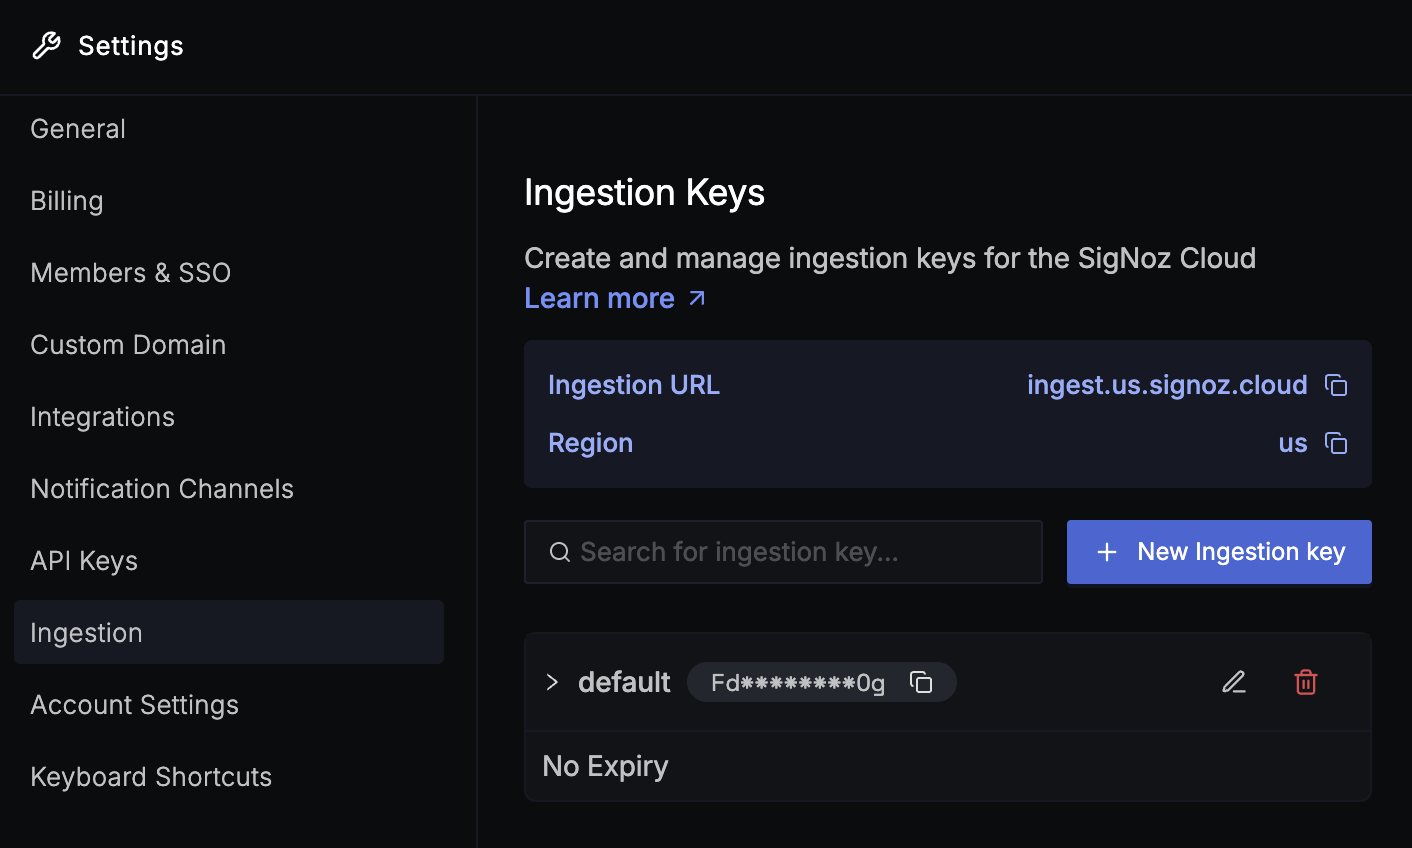
-
Copy your Ingestion URL and provide it as your Endpoint in the Render Dashboard.
Make sure to include
https://at the beginning, for example: -
Create a + New ingestion key or copy an existing one. Provide this value as your Ingestion key in the Render Dashboard.

After you save your changes, Render metrics start to appear in the Metrics tab of your Signoz Cloud dashboard within a few minutes:

Other providers (custom)
Consult this section only if your observability provider isn't listed above.
Render can push service metrics to your OpenTelemetry-compatible endpoint, if that endpoint authenticates requests via an API key provided as a bearer token in an Authorization header.
If your provider's endpoint supports authentication via bearer token:
-
Consult your provider's documentation to obtain your OpenTelemetry endpoint and API key.
-
Specify Custom as your provider in the metrics stream creation dialog, then provide your endpoint and API key in the corresponding fields.
If your provider's endpoint requires a different authentication method:
-
Please submit a feature request to let us know about your provider's requirements.
-
You can spin up your own OpenTelemetry collector (such as the official vendor-agnostic implementation). Your collector's endpoint can receive metrics from Render, then transform and forward them to your provider using whatever authentication method it expects.
Reported metrics
Render streams service metrics that pertain to the following categories:
All metrics use OpenTelemetry JSON format. The first component of each metric's name is render (e.g., render.service.memory.usage).
Some observability providers transform metric names to match their conventions.
For example, Grafana converts the metric render.service.memory.usage to render_service_memory_usage_bytes.
After you set up your metrics stream, inspect incoming data in your provider's dashboard to verify how it identifies Render metrics.
See names, descriptions, and included properties for each reported metric below.
Universal properties
All reported metrics include the following properties:
| Property | Description |
|---|---|
|
The name of the service (e.g., Grafana displays this property as |
|
The ID of the service (e.g., |
|
For most metrics, this is the ID of the metric's associated service instance (e.g., Everything before the final hyphen is the service ID ( This value enables you to segment metrics by individual instances of a scaled service, and to identify when a service's instances are cycled as part of a redeploy. |
The following properties are also universal but optional:
| Property | Description |
|---|---|
|
The name of the service's associated project, if it belongs to one (otherwise omitted). |
|
The name of the service's associated environment, if it belongs to one (otherwise omitted). |
CPU
These metrics apply to all compute instances and datastores.
render.service.cpu.limit
The maximum amount of CPU available to a particular service instance (as determined by its instance type).
Includes universal properties only.
render.service.cpu.time
The cumulative amount of CPU time used by a particular service instance, in seconds.
To visualize changes to CPU load over time, apply a rate() function or similar in your observability provider.
Includes universal properties only.
Memory
These metrics apply to all compute instances and datastores.
render.service.memory.limit
The maximum amount of memory available to a particular service instance (as determined by its instance type), in bytes.
Includes universal properties only.
render.service.memory.usage
The amount of memory that a particular service instance is currently using, in bytes.
Includes universal properties only.
render.service.memory.rss
The amount of anonymous and swap cache memory that a particular service instance is currently using, in bytes.
Includes universal properties only.
render.service.memory.cache
The amount of page cache memory that a particular service instance is currently using, in bytes.
Includes universal properties only.
Network
These metrics apply to all compute instances and datastores.
render.service.network.transmit.bytes
The cumulative number of bytes transmitted by a particular service instance.
To visualize changes to network traffic over time, apply a rate() function or similar in your observability provider.
Includes universal properties only.
render.service.network.receive.bytes
The cumulative number of bytes received by a particular service instance.
To visualize changes to network traffic over time, apply a rate() function or similar in your observability provider.
Includes universal properties only.
HTTP requests
These metrics apply only to web services.
HTTP request metrics are not reported per instance.
Render aggregates these metrics across all instances of a given web service. For these metrics, the value of service.instance.id matches that of service.id.
render.service.http.requests.total
The cumulative number of HTTP requests that a given service has received across all instances, segmented by the properties below.
To visualize changes to request load over time, apply a rate() function or similar in your observability provider.
Includes universal properties, along with the following:
| Property | Description |
|---|---|
|
The destination domain for incoming requests. This can be your service's |
|
The HTTP status code returned by the service ( |
render.service.http.requests.latency
Provides a particular web service's p50, p95, or p99 response time, segmented by the properties below.
Includes universal properties, along with the following:
| Property | Description |
|---|---|
|
Indicates the percentile of the provided latency value. One of the following:
|
|
The destination domain for incoming requests. This can be your service's |
|
The HTTP status code returned by the service instance ( |
Data storage
Each of these metrics applies to one or more of Render Postgres, Render Key Value, and persistent disks.
render.service.disk.capacity
The total capacity of a service's persistent storage, in bytes.
Applies to Render Postgres databases and persistent disks.
Includes universal properties only.
render.service.disk.usage
The amount of occupied persistent storage for a service, in bytes.
Applies to Render Postgres databases and persistent disks.
Includes universal properties only.
Disk I/O
The following metrics apply to Render Postgres and Render Key Value instances.
render.service.disk.read.bytes
The cumulative number of bytes read from disk by a particular service instance.
To visualize changes to disk read activity over time, apply a rate() function or similar in your observability provider.
Includes universal properties only.
render.service.disk.read.count
The cumulative number of read operations performed on disk by a particular service instance.
To visualize changes to disk read activity over time, apply a rate() function or similar in your observability provider.
Includes universal properties only.
render.service.disk.write.bytes
The cumulative number of bytes written to disk by a particular service instance.
To visualize changes to disk write activity over time, apply a rate() function or similar in your observability provider.
Includes universal properties only.
render.service.disk.write.count
The cumulative number of write operations performed on disk by a particular service instance.
To visualize changes to disk write activity over time, apply a rate() function or similar in your observability provider.
Includes universal properties only.
Render Key Value
The following metrics apply to Render Key Value instances.
render.keyvalue.connections
The number of active connections to a particular Render Key Value instance.
Includes universal properties only.
render.keyvalue.connection.limit
The maximum number of concurrent connections supported for a particular Render Key Value instance (as determined by its instance type).
Includes universal properties only.
Render Postgres
The following metrics apply to Render Postgres instances.
render.postgres.connections
The number of active connections to a particular Render Postgres instance.
Includes universal properties, along with the following:
| Property | Description |
|---|---|
|
The name of the PostgreSQL database created in the instance (e.g., This value usually does not match the value of |
render.postgres.connection.limit
The maximum number of concurrent connections supported by a particular Render Postgres instance (as determined by its instance type).
Includes universal properties only.
render.postgres.database.size
The size of a particular PostgreSQL database, in bytes.
Includes universal properties, along with the following:
| Property | Description |
|---|---|
|
The name of the PostgreSQL database created in the instance (e.g., |
render.postgres.indexes.size
The total size of all indexes in a particular PostgreSQL database, in bytes.
Includes universal properties, along with the following:
| Property | Description |
|---|---|
|
The name of the PostgreSQL database created in the instance (e.g., |
render.postgres.replication.lag
The delay between when a change occurs on the primary Render Postgres instance and when its read replica (if it has any) fully replicates that change, in milliseconds.
Includes universal properties, along with the following:
| Property | Description |
|---|---|
|
The hostname or identifier of the read replica. |
render.postgres.replication.apply.lag
The delay between when a transaction commits on the primary Render Postgres instance and when its read replica (if it has any) applies those changes, in milliseconds.
Includes universal properties, along with the following:
| Property | Description |
|---|---|
|
The hostname or identifier of the read replica. |
render.postgres.slow.lock.count
The total number of slow locks on a particular Render Postgres instance. A slow lock occurs when a query waits an extended period to acquire a database lock.
Includes universal properties only.
render.postgres.slow.lock.time
The cumulative wait time for slow locks on a particular Render Postgres instance, in seconds.
Includes universal properties only.
render.postgres.table.scans
The total number of sequential table scans performed on a particular database within a Render Postgres instance.
Includes universal properties, along with the following:
| Property | Description |
|---|---|
|
The name of the PostgreSQL database created in the instance (e.g., |
render.postgres.transaction.exhaustion
The percentage of available transaction IDs used by a particular PostgreSQL database. PostgreSQL databases have a maximum of approximately 2.1 billion transaction IDs before wraparound occurs.
Includes universal properties, along with the following:
| Property | Description |
|---|---|
|
The name of the PostgreSQL database created in the instance (e.g., |
render.postgres.transaction.volume
The cumulative number of transactions (i.e., commits and rollbacks) on a particular Render Postgres instance.
To visualize changes to transaction activity over time, apply a rate() function or similar in your observability provider.
Includes universal properties only.
History of changes to reported metrics
| Date | Change |
|---|---|
|
|
Added the following Render Postgres transaction metrics: |
|
|
Added the following Render Postgres metrics: |
|
|
Added the following Render Postgres metrics:
Added the following disk I/O metrics: |
|
|
Added the following datastore connection metrics:
Added the following memory metrics: Added the following networking metrics: |
|
|
Added the following initial set of metrics: |