Switching clouds? Get up to $10K in credits + hands-on help.
Apply nowStream Render service metrics to your observability provider
Workspaces with a Professional plan or higher can create a metrics stream to push OpenTelemetry-formatted service metrics to an observability provider, such as Grafana or Honeycomb.
Render streams metrics related to CPU and memory usage, HTTP requests, and more.
Render provides simplified configuration for several popular providers, and you can connect other providers by first routing metrics through your own OTel collector.
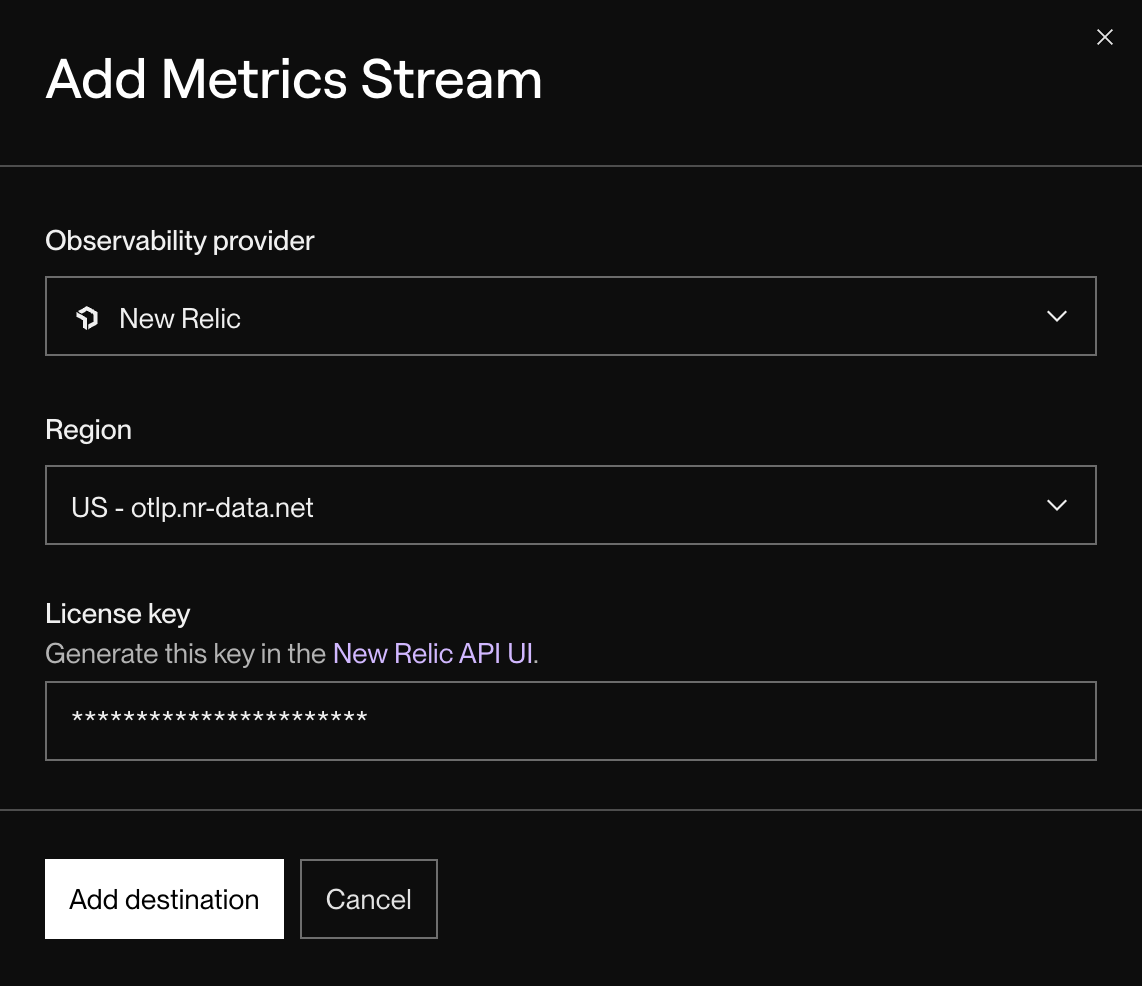
In the Render Dashboard, set up a metrics stream from your workspace's Integrations > Observability page. Your provider will start receiving metrics for all services in your workspace besides static sites.
Learn more about setup and reported metric types in the documentation.