Background
I watch our data pipeline notifications channel like a hawk, and it’s not really meant for conversation. So it definitely caught my attention when Anurag, our CEO, dropped in asking “Do we need to run dbt again?” It’s a fair question that comes from a legitimate eagerness to see fresh numbers. But it's specific enough to raise flags for the data team: why does the CEO feel the need to nudge us toward manually rerunning the pipeline? What does that say about gaps in our processes or messaging?
When I joined Render, the data team doubled in size, growing from one member to two. We quickly upgraded dbt-core from v1.4 to v1.11, introduced incremental tables and a new layered architecture, cut costs, and brought our analytics engineering capabilities up to modern standards. But one vestige of the olden times stayed in our architecture and caused near-constant frustration: a late-arriving but incredibly important dataset. This particular dataset contained invoice projections throughout the month, and was built daily using a Golang job that Anurag wrote eight years ago. Because it was tightly intertwined with our billing process, it couldn’t simply be plucked out and integrated into the rest of the pipeline.
To cover for this late-arriving data, our dbt project ran twice each day on a cron job hosted on Render: once early in the morning, and once again mid-morning. If the Golang job or our data extraction and loading tool failed or ran slowly, dbt might need to run a third time. This would raise BigQuery costs and require significant manual checking and rerunning by the data team. To boot, there was little observability across the whole system aside from per-system or per-job logs in different places — on Render, locally, inside software UIs. When someone asked whether the data was ready, estimating the timeline meant checking several systems, from BigQuery to Stitch to dbt.
All in all, the 7 or 8 processes in our data pipeline were spaced just far enough apart that, on a normal day, everything would finish, albeit redundantly and in a way that was frustrating to debug. In Metabase, our primary analytics platform, a small progress bar compared the sizes of two datasets, one dependent on the Go projection job and one not, and served as a rough proxy for data pipeline completion. But after enough time stuck at 44%, our CEO, who was watching the dashboard more closely than we were, came straight to the channel and asked, quite resolutely, “dbt again?”
Approaching a solution
The easiest dbt-specific solution was to split our models into two tagged sets: one that depended on the projection data, and one that did not. If the projection had not finished, been extracted, or loaded yet, we could run the projection-independent models first. Once the projection was ready, we could run the dependent models. On days when the projection was ready before dbt started, we could run the full project as usual.
This alone would cut our dbt costs in half and remove the guesswork around whether the projection job had finished. All we needed was a sentinel from the projection job, which did not exist at the time.
But even this simple fix required branching logic, and dbt was only one part of the problem. We still had other tasks to coordinate like waiting for extraction and loading, pushing documentation into Metabase, running cost monitoring packages, running Hightouch, and sending the daily report email. These steps were separated mostly by time and loosely monitored.
We needed a system that could:
- wait for an external task to complete,
- run with branching logic,
- orchestrate individual tasks that could be investigated and rerun, and
- pass packets of information between tasks that would inform their configuration, or specify the branch to take.
I investigated solutions like Prefect and Dagster. They offer per-model task-like blocks, but we would have gotten the most value from them with a paid contract. I thought of Airflow, but with a two-person team and a single dbt project, it seemed like too much overhead.
Our new Workflows product, then in beta, was the perfect solution. I could chain individual tasks together, configure them with decorators, and pass small packets of information between them. Tasks could also retry natively for long stretches while waiting for another process to finish. Plus, I’d be dogfooding our own product.
Engineering walkthrough
The nightly DAG and task ecosystem
A cron job starts the workflow every morning. It also polls for completion, which prevents the workflow from restarting mid-run. From there, a few gates determine which dbt build command should run: checking whether the data transfer is complete, confirming that the projection job is done, and waiting for the projection data to be extracted and loaded:
The workflow checks early whether the full dbt build can run right away. If not, it still runs the projection-independent work first and waits only for the projection-dependent step. Then dbt runs via subprocess in the task, which allows for complete observability:
A background thread drains the subprocess’s stdout line by line into the task’s own logger while the process runs, so a 20-minute dbt build shows up in the dashboard log stream in real time instead of as one wall of text at the end. The task writes dbt’s files like manifest.json, catalog.json, and run_results.json to a GCS bucket for later retrieval by downstream events. Task completion events, with some metadata, write to a small BigQuery table called workflow_run_events, enabling both historical observability and a remarkably accurate estimate of when the data will be available. dbt’s native retry function resolves transient errors in the pipeline automatically. There’s an opportunity to use an agent to resolve other errors and either retry, or open a PR with a diagnosis and solution. That’s v2.
After dbt is done, the workflow runs several downstream tasks in parallel: syncing documentation, running cost monitoring pipelines, and invalidating and re-warming the Metabase cache for faster, more efficient dashboard loads. Each task reports its own status, so failures don’t disappear silently or block the others:
return_exceptions=True makes this non-blocking, but it comes with a real trap: without an explicit, logged home for each result, a failed task just sits quietly inside the returned list as an unclassified Exception object, invisible to any dashboard or alert. mark_downstream provides that home, so real failures won’t silently go missing from the pipeline’s completion alert.
Downstream, another daily task sends a Metabase dashboard to everyone at the company with updated data. It also posts a short pipeline summary to the data team’s Slack channel with Anurag: data processed with 100% of projections.
I’ve built other tasks alongside the main chain. One detects drift in Hightouch, our reverse ETL tool, by comparing live queries against the SQL we version control in dbt, then deploys approved changes. Another runs dbt and its downstream tasks manually, but only after a six-point safety check confirms there are no concurrent jobs and that the workflow is not currently building or being deployed. A third independent task gathers warning and error logs from each subprocess of the main run_pipeline orchestration task and displays them for quick error resolution across the entire pipeline. Each of these is diagrammed in the Appendix below, and anyone on the data team can administer all three of these independent tasks via a small dbt governance web service, also hosted on Render.
Piece by piece, our data ecosystem is becoming something we build, host, and operate ourselves.
Retry-as-poll: waiting without waiting
The “wait for projection ready” branching logic not only constitutes the linchpin of this workflow; it is, in fact, the raison d’être. At the time, the Go projection job did not emit any sort of sentinel signal that it was completed, and the Stitch API (our extract and load tool) does not provide any endpoint for per-table load completion. So we could not start the workflow based on a webhook or external API call. We needed some way to wait and poll until an external signal shows up.
Of course there is a Python-native way of doing this, namely a while not ready: sleep(60) inside a loop. But that approach burns compute the entire time it waits. Fortunately, Render’s retry engine works as a free “wait until ready” primitive.
I configure the task with a number of retries (max_retries), a duration between each poll (wait_duration_ms), and a flat interval for a poll cadence (backoff_scaling=1). Nowadays, the Go projection job writes a sentinel row to a small BigQuery reports table with the start and finish timestamp, and the number of successful profiles written. The workflow polls for that sentinel row, then checks that the successful profiles have also landed in BigQuery. It burns no compute between polls, and the workflow continues once the data is ready.
Three execution modes for optimized testing and a thin Render surface
One particular pattern worth highlighting is the three workflow execution modes: prod, dry run, and simulate. Together, they support CI/CD, full-suite testing, and the option to move the workflow into another system later. I thought a lot about the future of Render and its data team in this process. Someday, at 1000 employees, this workflow might need to look fairly different and involve other systems. So, how do I thin out the actual Render SDK mechanics while keeping vendor-agnostic functions and testing?
Mode | Trigger | Network & writes | What it proves |
|---|---|---|---|
Prod | Nightly cron job | Full real network calls; writes real production tables and rows | The actual pipeline, end to end |
Dry run | After every deploy | Briefly touches the network for real reads, but skips or minimally writes | Catches broken env var configs and new features right after a deploy, before the next real nightly run touches production data |
Simulate | Render CLI, invoked in CI | Never touches the real network; every task takes its stubbed branch and returns a fake result | Full-suite testing of branching logic and the real Render retry/backoff mechanics, on a dev server spun up in CI |
To keep the Render SDK out of most of the codebase, I register the app and each task in main.py instead of in domain-specific files. This makes the task logic easier to test without installing the SDK or running a dev server. The import and task registration in main.py look like this:
Every implementation module can be imported and unit-tested in a bare virtualenv with no render_sdk, no cloud SDKs, and no dev server. The SDK-touching surface is reduced to this one file doing registration and thin delegation.
I run this config through environment variables and set up a context manager, which allows me to set the execution path in the correct format and through child subtasks:
simulate_enabled() is just a boolean that each task checks before doing any real work. If simulation mode is on, the task returns a stubbed result before making network calls; if not, it runs normally. This simple guard clause powers the whole simulate-mode test matrix without requiring a mocking library.
Production runs every night. After each deployment, dry-run mode tests environment variable configuration and new features; it briefly touches the network for real reads, but skips or minimizes writes. Then, simulate runs in CI. It invokes the Render CLI, starts a dev server, exercises the task branches, and verifies Render mechanics like retry and backoff. This way, Render is simply a thin layer on top of an otherwise independent project. I follow a similar pattern for BigQuery calls, so if we ever move off BigQuery, this workflow will not be a difficult part of the migration.
Outcomes
The data pipeline workflow has been running successfully for about 30 days. On most days, it follows the expected path: run the dbt projection-independent partial build → wait for the projection data to be ready → then run the dbt projection-dependent partial build.
Dashboards are loading faster thanks to the warm Metabase cache. And while costs are difficult to predict with a growing data corpus, as it stands now the reduction in unnecessary dbt runs will save us $30K this year, and the efficient Metabase caching will save us $70K.
One of the most exciting realizations from this process was how extensible the framework is.
The Metabase caching task started as a quick brainstorm with my colleague, then slotted easily into an already well-structured workflow. The dbt governance app and its accompanying workflows were even more incidental, not part of the original plan in any capacity. It now gives the team customizable control over the entire system and a faster path to resolving errors. It’s also a testament to the symbiosis of Render products: a workflow behind a web service is becoming an increasingly common pattern across our internal tools.
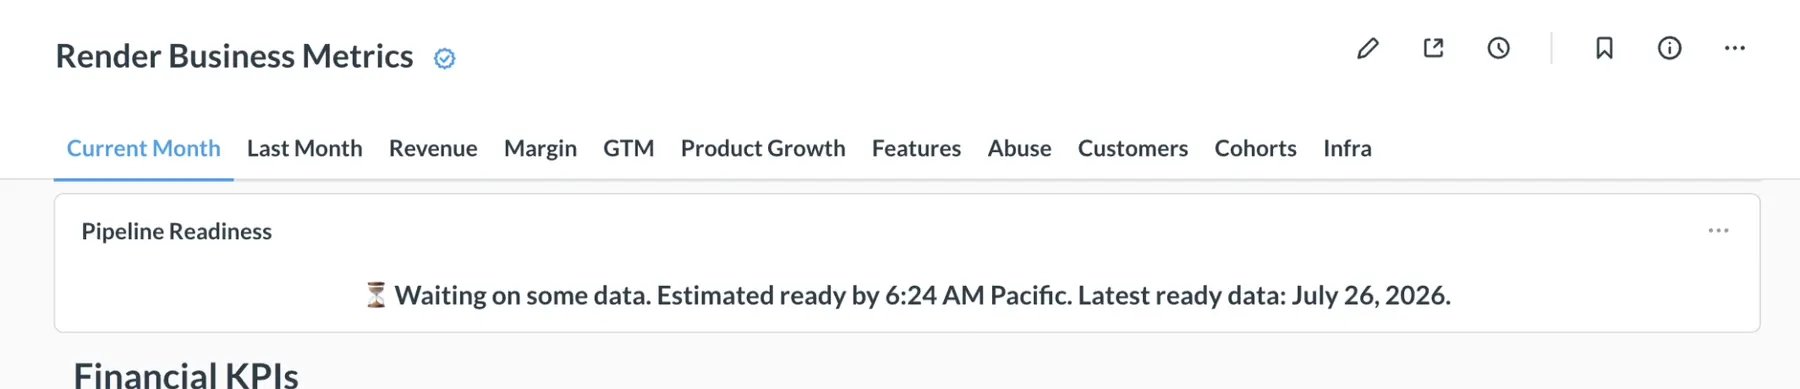
On the alerting and messaging side, the workflow_run_events table records historical task timings and wait-check statuses, giving Metabase a remarkably accurate estimate of when the full data pipeline will complete.
And good news for everyone involved: Anurag offered his congratulations to the team on shipping the workflow. Since then, we haven’t heard a peep from him in the channel.
Appendix
Each of the following independent tasks operates outside the main nightly chain and is administered through the dbt-governance web service.
Hightouch drift review
A drift between repository SQL and live Hightouch SQL is genuinely ambiguous, so every drifted model is alerted and left untouched until a human makes an explicit decision.
Manual dbt run safety checks
Six checks guard against concurrent dbt jobs, an in-progress nightly run, or a stale deploy, each captured in the returned safety snapshot.
Diagnostic run reports
The full report aggregates every warning and error across the run's task tree, generated on demand only when a human opens it.