Switching clouds? Get up to $10K in credits + hands-on help.
Apply nowJuly 21, 2025
New
In-dashboard metrics now display service events
Service metrics in the Render Dashboard now highlight service events that occurred during the selected time frame:
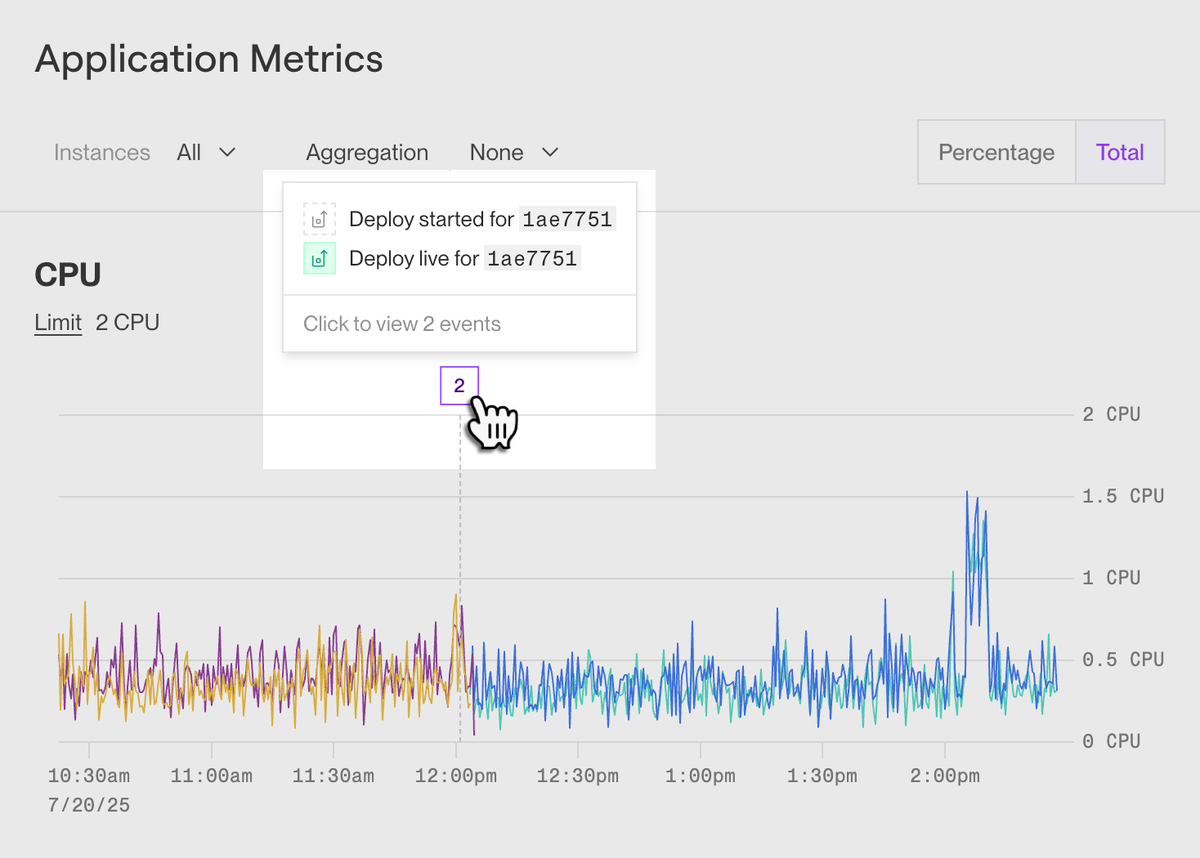
Service events in Render Dashboard service metrics
By viewing metrics and events together, you can quickly pinpoint the underlying cause of performance changes in your service.
By default, graphs display events related to service deploys and instance failures. Use the Filter events dropdown to select from a wide variety of additional event types:
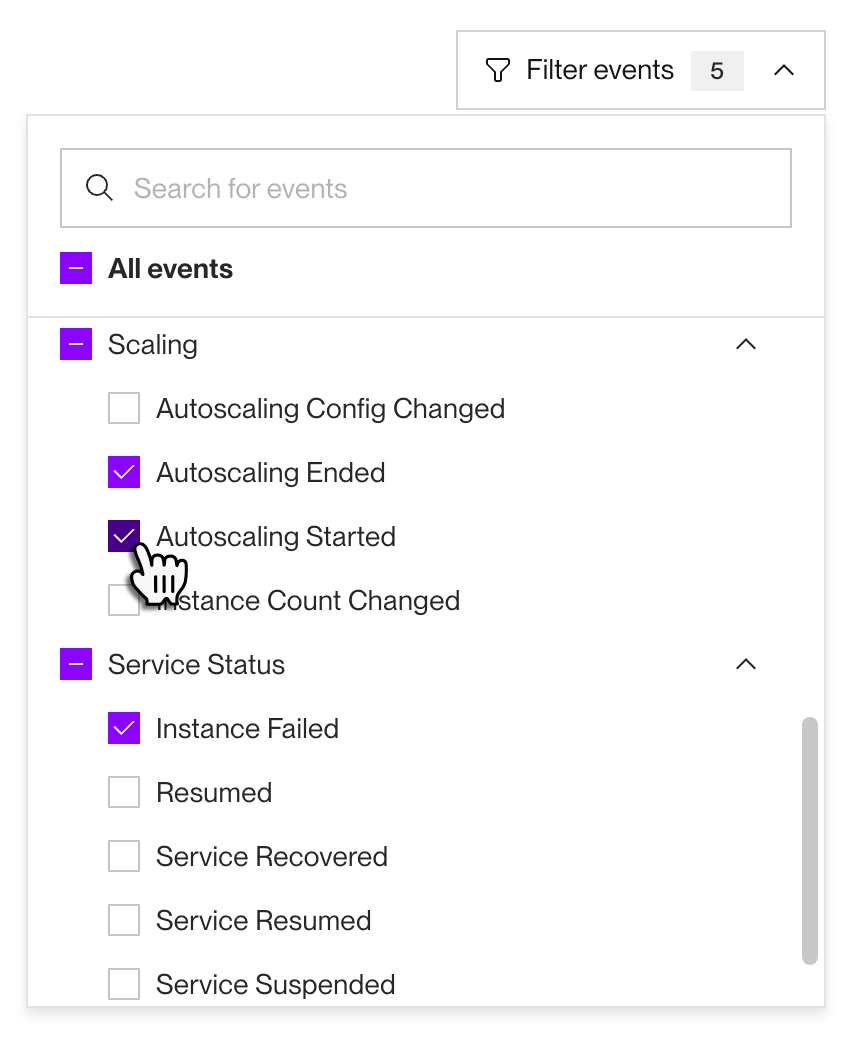
Selecting service events to display in metrics
Click any event in a metrics graph to view more details about it.
Learn more about service metrics in the documentation.