Switching clouds? Get up to $10K in credits + hands-on help.
Apply nowApril 18, 2024
New
Enhanced service metrics in the Render Dashboard and API
Powerful new application metrics are available for paid instances in the Render Dashboard:
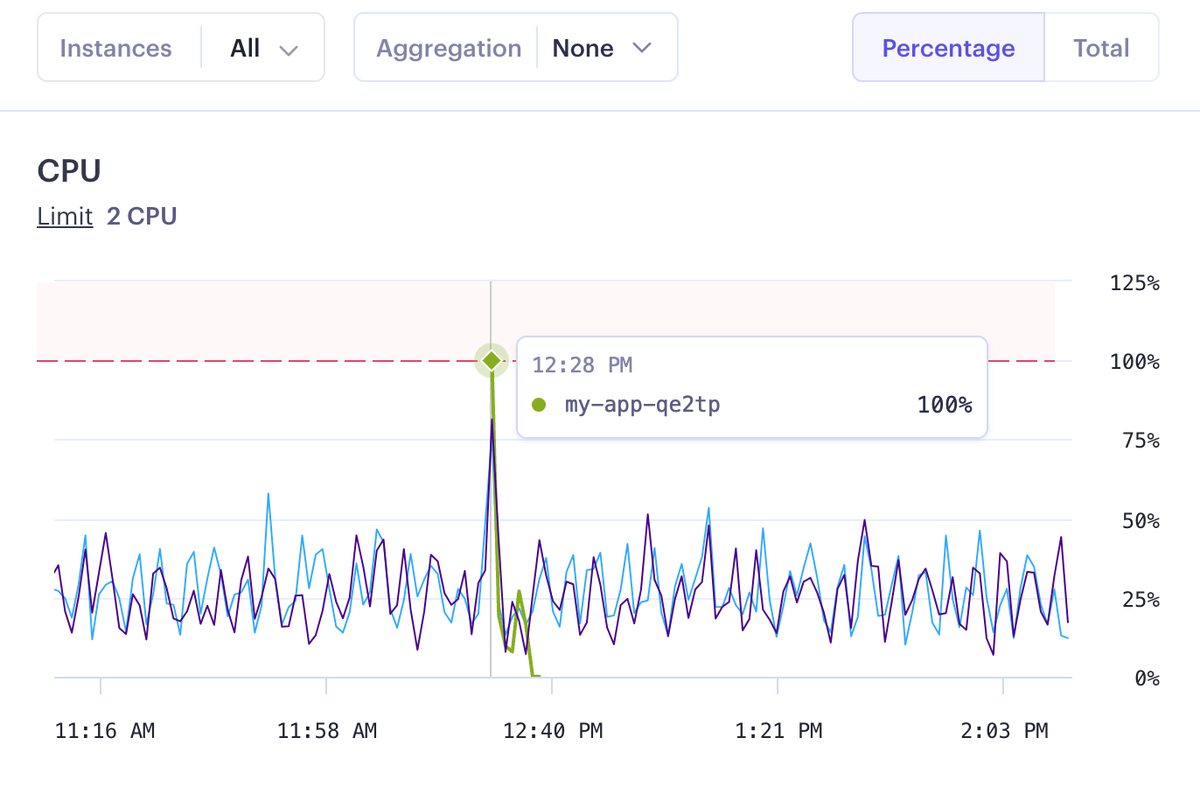
CPU metrics in the Render Dashboard
From your service's Metrics page, you can now visualize:
- CPU and memory usage over time, segmented by instance for scaled services
- HTTP request volume and response latency, segmented by status code, path, and more
- Response latency metrics require a team account.
Metrics from the past 7 days are available for individual accounts. Teams can view metrics from the past 14 or 30 days, depending on their plan.
Learn more in the documentation.