Stripe announced their App Marketplace at the end of May, and today it’s open to all Stripe merchants. We’re excited to share that our SQL Insights app for Stripe is in public beta.
While Stripe was planning the launch of their App Marketplace, they asked if we were interested in contributing an app focused on the needs of developers. We decided to take on the challenge, but we also wanted to expand the audience to include other data-savvy users.
Using SQL Insights you can query data about your business in real-time using standard SQL. Your Stripe data is automatically synchronized to an encrypted PostgreSQL database so that Engineering, Finance, Product Management, Marketing, and Business Operations teams can query it using a wide range of tools – from the psql command line client, to visual data exploration tools like Metabase, Mode Analytics, and Tableau, to data pipeline management tools like Apache Airflow and Dagster.
Let’s look at how how to set up Render’s SQL Insights app, and then how to answer some common business questions using the data:
- What are my most recent transactions?
- What are the details of last month’s transactions?
- What are the details of quarter-to-date transactions?
- What were the most recent payouts to my bank account?
- How does cash flow change month-to-month?
- How much spend each month is from new customers vs. existing customers?
- How many charge attempts per customer are required until we get a successful payment?
Setting up SQL Insights
First, you’ll need to set up the SQL Insights app in the Stripe App marketplace. Here are some instructions to help you out.
During the setup process, you will be asked to select an existing Render PostgreSQL database or create a new one. Then Render will copy all your Stripe data into that database and keep it up to date. The app takes care of copying your Stripe data to the appropriate SQL tables and managing the entire synchronization process, reducing any DevOps burden on you or your team.
Exploring the Data
Once the data synchronization has finished, you can immediately start running SQL queries against it. Grab the External Connection String for the PostgreSQL database from the Render Dashboard and provide it to your preferred SQL query tool. psql is a common PostgreSQL command-line client, but you can use any tool that is compatible with PostgreSQL.
What are my most recent transactions?
Let’s start with a simple query to look at the five most recent transactions.
created_at | id | amount | type | currency | source_id |
|---|---|---|---|---|---|
2022-07-09 01:16:27+00 | txn_1Kl31e0C2xjz0U1l3YPzP043 | -580 | payout | usd | po_1KcJAJ8wS98Cm5uGDtsLRgKp |
2022-07-07 23:17:39+00 | txn_3KbzSw6ozmwjnuaVnbLrgVSx | 330 | charge | usd | ch_3KdCdLTFn3hX1KgXnqwZIDoJ |
2022-07-07 23:11:34+00 | txn_3KRqW5sJRzS960lZTMVfr994 | 330 | charge | usd | ch_3KAsL17UyXaiWlnVkgr9IPlP |
2022-07-05 01:31:41+00 | txn_1Ki6FxQ739wcs6XrlOMvI1rw | -53 | payout | usd | po_1K93konwYNDMlpKJXGNa1Boa |
2022-07-04 14:59:19+00 | txn_3Kv9GPvBNZggo1efWg4MbydE | 85 | charge | usd | ch_3KeR463CSKb4OdNSmueZI2n0 |
Notice that we’re using PostgreSQL’s to_timestamp() function to convert the Unix time provided by Stripe to a human-readable (and PostgreSQL’s native) timestamp. This is one of the benefits of having your Stripe transaction data in a SQL database. Not only do you get to use standard SQL to interact with the data but you also get convenience functions like to_timestamp() – and many others.
What are the details of last month’s transactions?
What if instead, we want to view all transactions from last month to understand what contributed to our meeting last month’s revenue goal? PostgreSQL’s interval syntax makes that easy.
created_at | id | amount | type | currency | source_id |
|---|---|---|---|---|---|
2022-06-14 01:13:51+00 | txn_1KMDHeXi6CQnVgieWubDGmmb | -67 | payout | usd | po_1KtQhAYYNPe1WDnV1AliMgz1 |
2022-06-11 18:39:39+00 | txn_3KzcmI2eYfEh84Txy0UqpNjr | 100 | charge | usd | ch_3KgSzJbbYfH8PzlHljj6b2qS |
2022-06-01 01:09:32+00 | txn_1K320SbTb6gZDcmugoxuJjNu | -1186 | payout | usd | po_1KIs46MfFen5lPasGxHgHSJl |
... |
What are the details of quarter-to-date transactions?
Similarly, PostgreSQL also makes it easy to view all transactions quarter-to-date to understand if we’re on track toward our quarterly revenue goal.
created_at | id | amount | type | currency | source_id |
|---|---|---|---|---|---|
2022-07-01 23:11:34+00 | txn_3KIBfcP4saWP28viL8lg6ZgJ | 330 | charge | usd | ch_3K5XP25f7qS2WZHtgA1SzWFd |
2022-07-05 01:31:41+00 | txn_1KDPOj6hjvv6Ro5IxiHIuMHM | -53 | payout | usd | po_1KuqJTpPZoq1J0OsUI3wryI3 |
2022-07-04 14:59:19+00 | txn_3K3NMZe7uATx9d5hGljjPcRS | 85 | charge | usd | ch_3KvVv64Zl56yt3vkqXVBWZIP |
... |
What were the most recent payouts to my bank account?
We might also want to see how frequently funds are being paid out to our bank account in the current quarter. We can refine the previous query a bit to show us only the transactions that were payouts.
created_at | id | amount | type | currency | source_id |
|---|---|---|---|---|---|
2022-07-03 01:16:27+00 | txn_1KyiPpfbSAaO6FRlkPXiM6M7 | -580 | payout | usd | po_1K69xzo6HkiusAKUEPuZkc8y |
2022-07-05 01:31:41+00 | txn_1KLp2JYq0CwgeqmE8flJCwVC | -53 | payout | usd | po_1K2JUlang77ETJVXdyt2TyiX |
But what happens as our queries become more complex? It’s useful to be able to save and name them so you or others at your company can run them regularly. Additionally, charts can help identify trends and uncover insights not readily apparent in a large table of data.
Visualize Stripe Data
Metabase is an open source, web-based SQL querying and charting tool that takes just a few clicks to deploy to Render. We can use it to easily save, name, and visualize even the most complex SQL queries. But if writing and debugging complex SQL worries you, Metabase can help there too. Its point-and-click query and chart builder makes data accessible to those who aren’t SQL pros.
Here’s what Metabase looks like right after deploying it and connecting it to our Stripe data. It helps you start exploring even if you don’t know the exact question you want to answer.
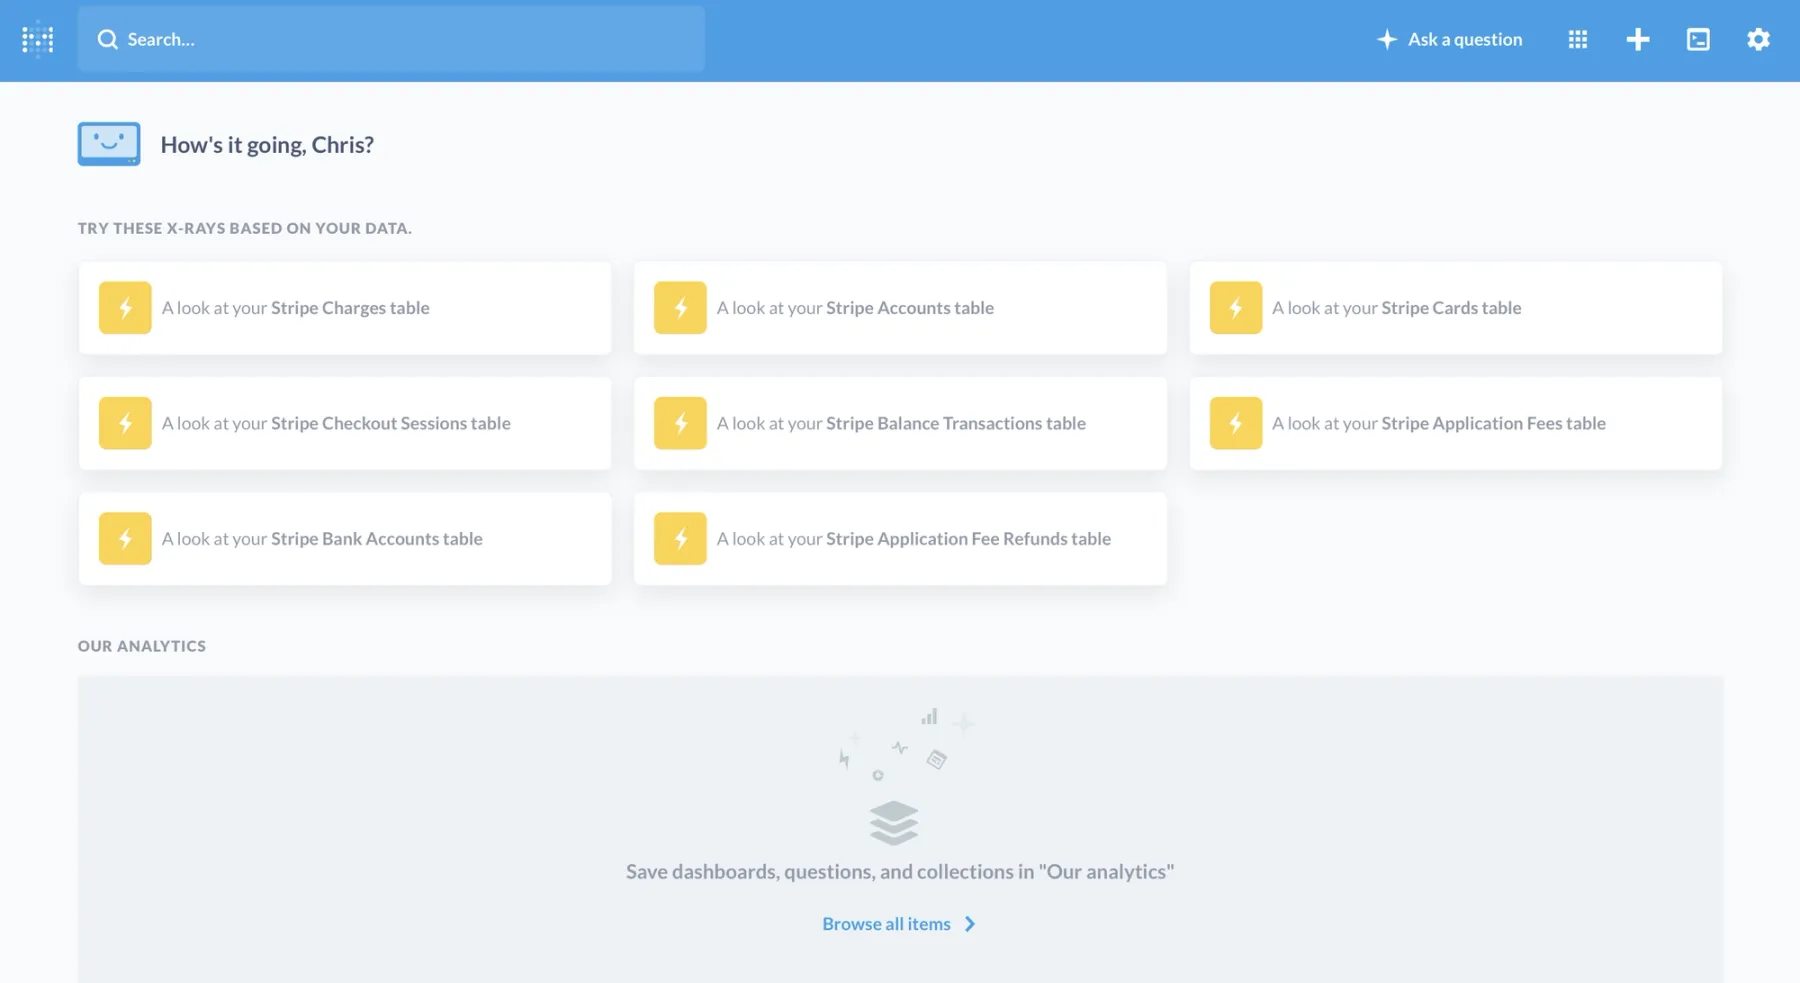
Follow the instructions in Render’s Quickstart guide for Metabase to deploy it.
Now let’s start exploring the data visually!
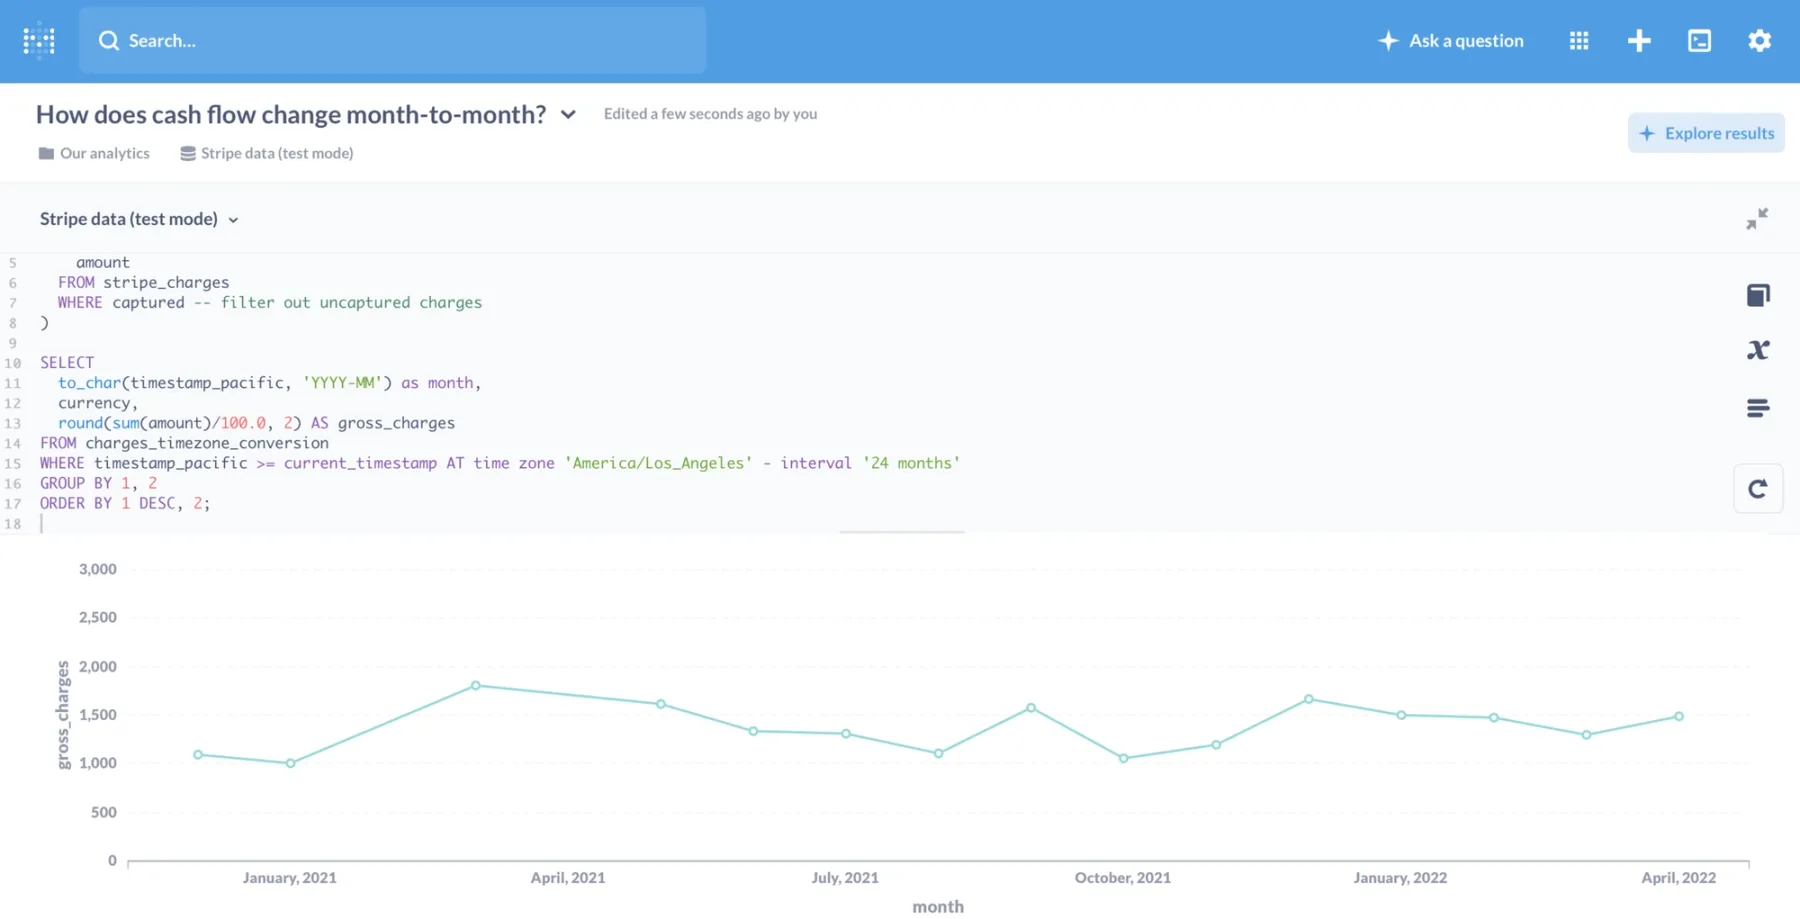
How does cash flow change month-to-month?
Here’s a query we can save in Metabase and then visualize with a line chart, helping us better understand current cash flow relative to past months.
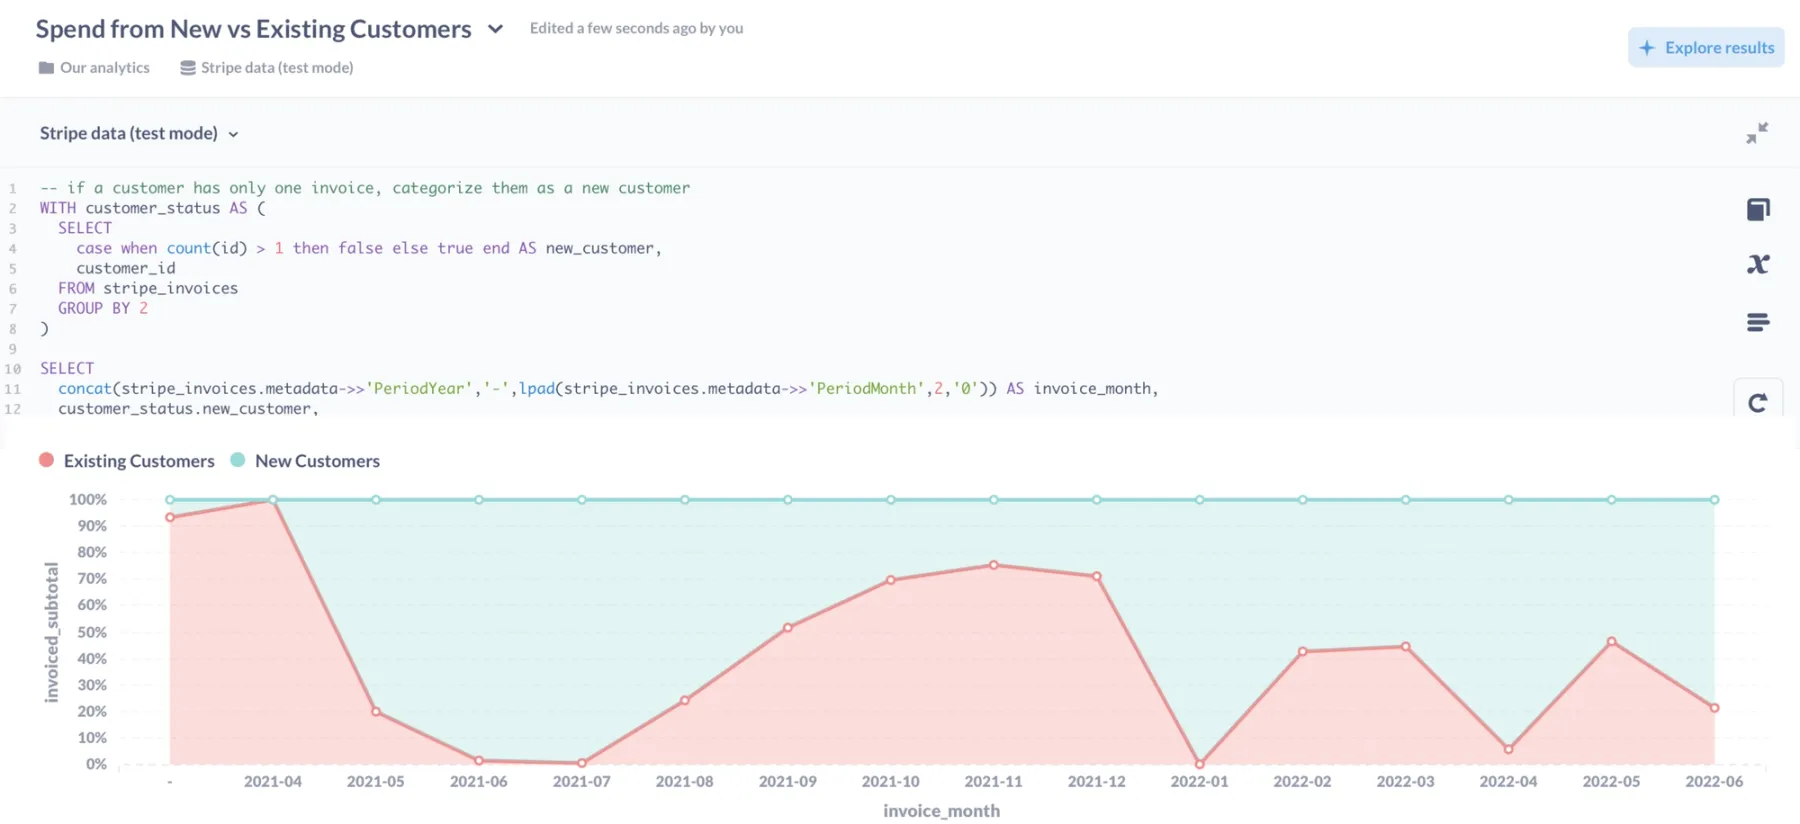
How much spend each month is from new customers vs. existing customers?
For subscription-based businesses, understanding if growth is coming from new or existing customers can be useful to optimize growth investments. The following query categorizes a customer as new if they’ve only ever received one invoice from you. It then shows revenue breakout from those new customers compared to existing customers.
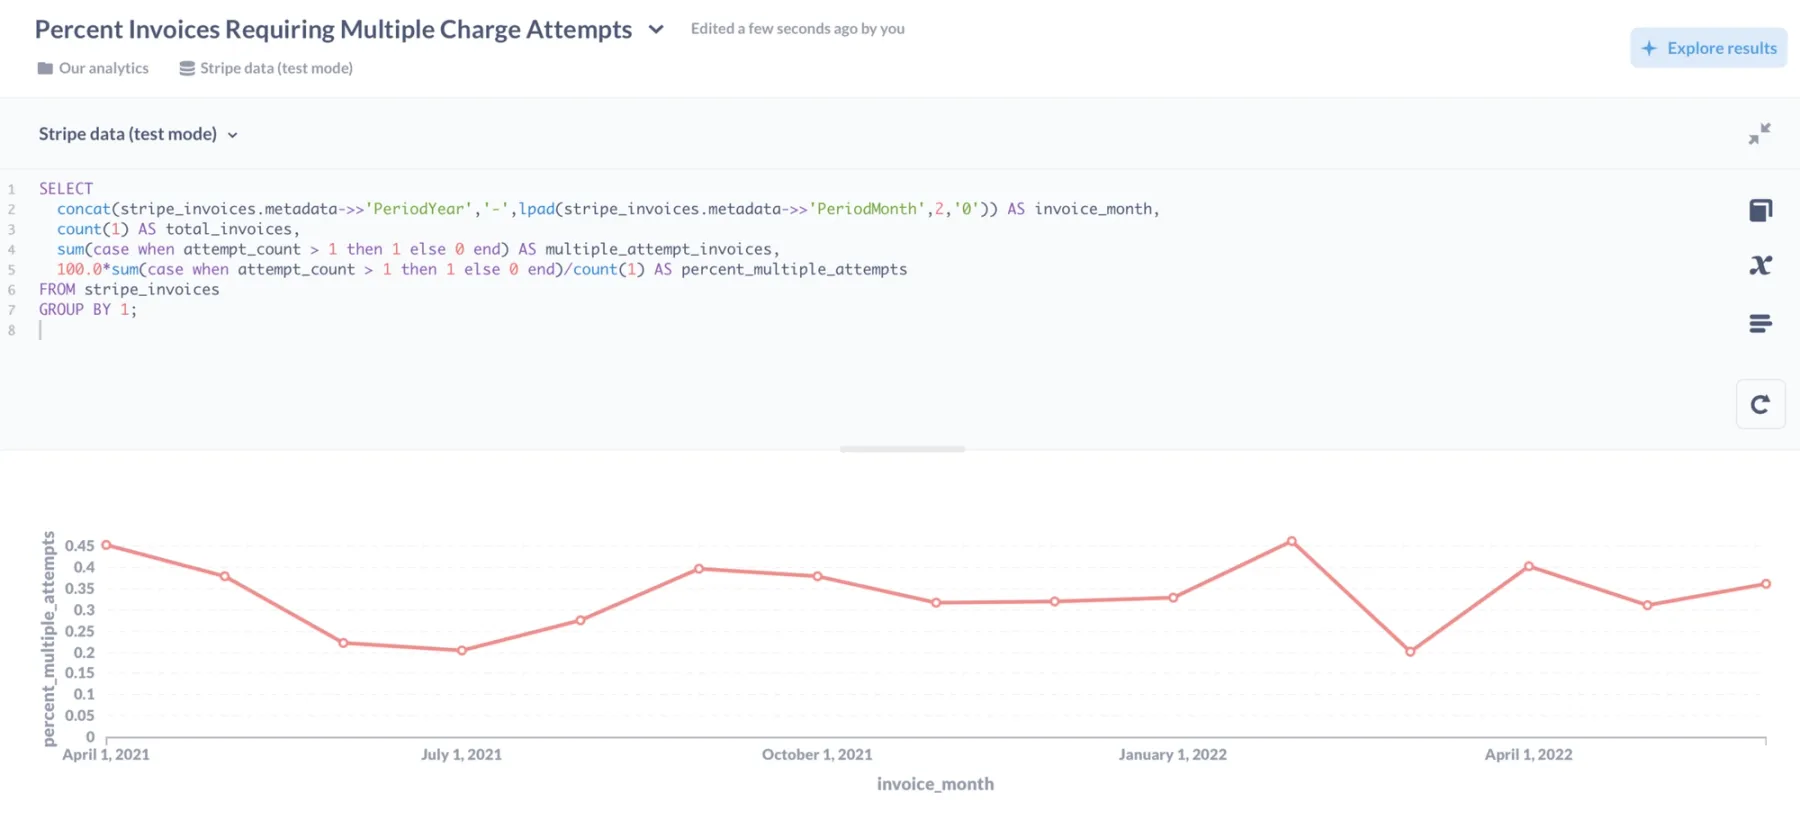
How many charge attempts per customer are required until we get a successful payment?
Having to attempt a charge on a customer’s credit card multiple times delays your business receiving those funds. Knowing the portion of invoices that required more than one charge attempt each month can help you understand the efficiency of your billing process. Here’s a query and a chart to look at that.
SQL Insights + Stripe
Render SQL Insights + Stripe helps you speed through the tedious integration work often required to set up a business intelligence solution, reducing the time required before you can get meaningful insights about your business.
And Render can grow with you. Render can support not only one-off queries like the ones above but also more complex use cases as your business grows. We have a wide selection of Quickstart guides for business tools that can help you interact with your data. And you can easily upgrade your database’s storage, memory, or processing power as your data needs grow in volume and complexity.
Install Render SQL Insights here.