At Render, we love PostgreSQL. As with any technology, it has its sharp edges. Most of the time, PostgreSQL invisibly optimizes our queries, but sometimes, a query wreaks havoc. It’s a fact of life for people who work with databases.
This February, our staging pipeline got blocked due to what looked like a simple query:
Both sides of the join had relevant indexes, and the query included a LIMIT 1, but the query was still taking hours to run.
Scratching your head? We were too. (If you have a hypothesis already… we’re hiring.)
Here’s the story of how we identified, fixed, and debugged the core problems behind this query.
The canary: a blocked staging pipeline
Let’s start from the first signs of trouble.
One day, we noticed that deployments to our staging cluster had been blocked for hours. Our end-to-end tests hadn’t run. Among other things, these tests create, modify, and destroy database instances, and thus require “test” database instances to be set up.
The blockage meant we couldn’t deploy to production, because we require our production builds to first deploy to staging. The blocked tests also signaled a possible problem in new code we’d committed.
Time to dig in.
First clues: hanging migration, spiking DB metrics
We opened an internal incident to investigate and unblock the staging deploy. We quickly found two clues:
- A failing migration step: In the previous five deployment attempts, a specific database migration step had hung and never finished. We saw a timeout, but there were no error logs that pointed to a specific problem in code.
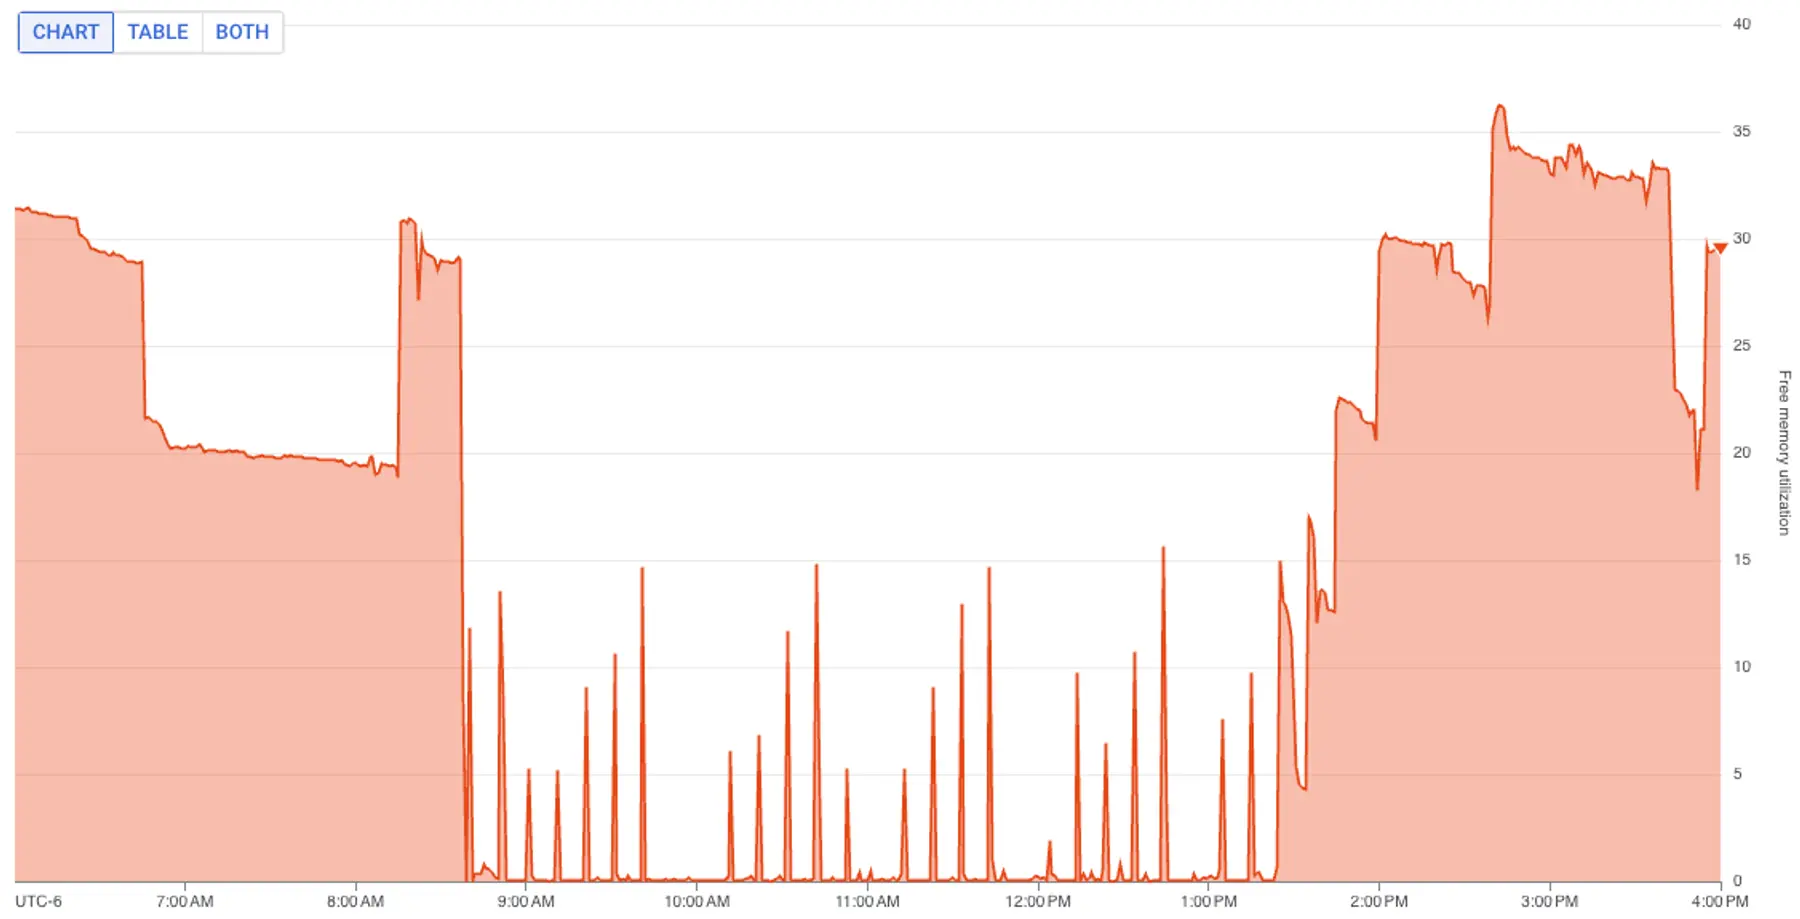
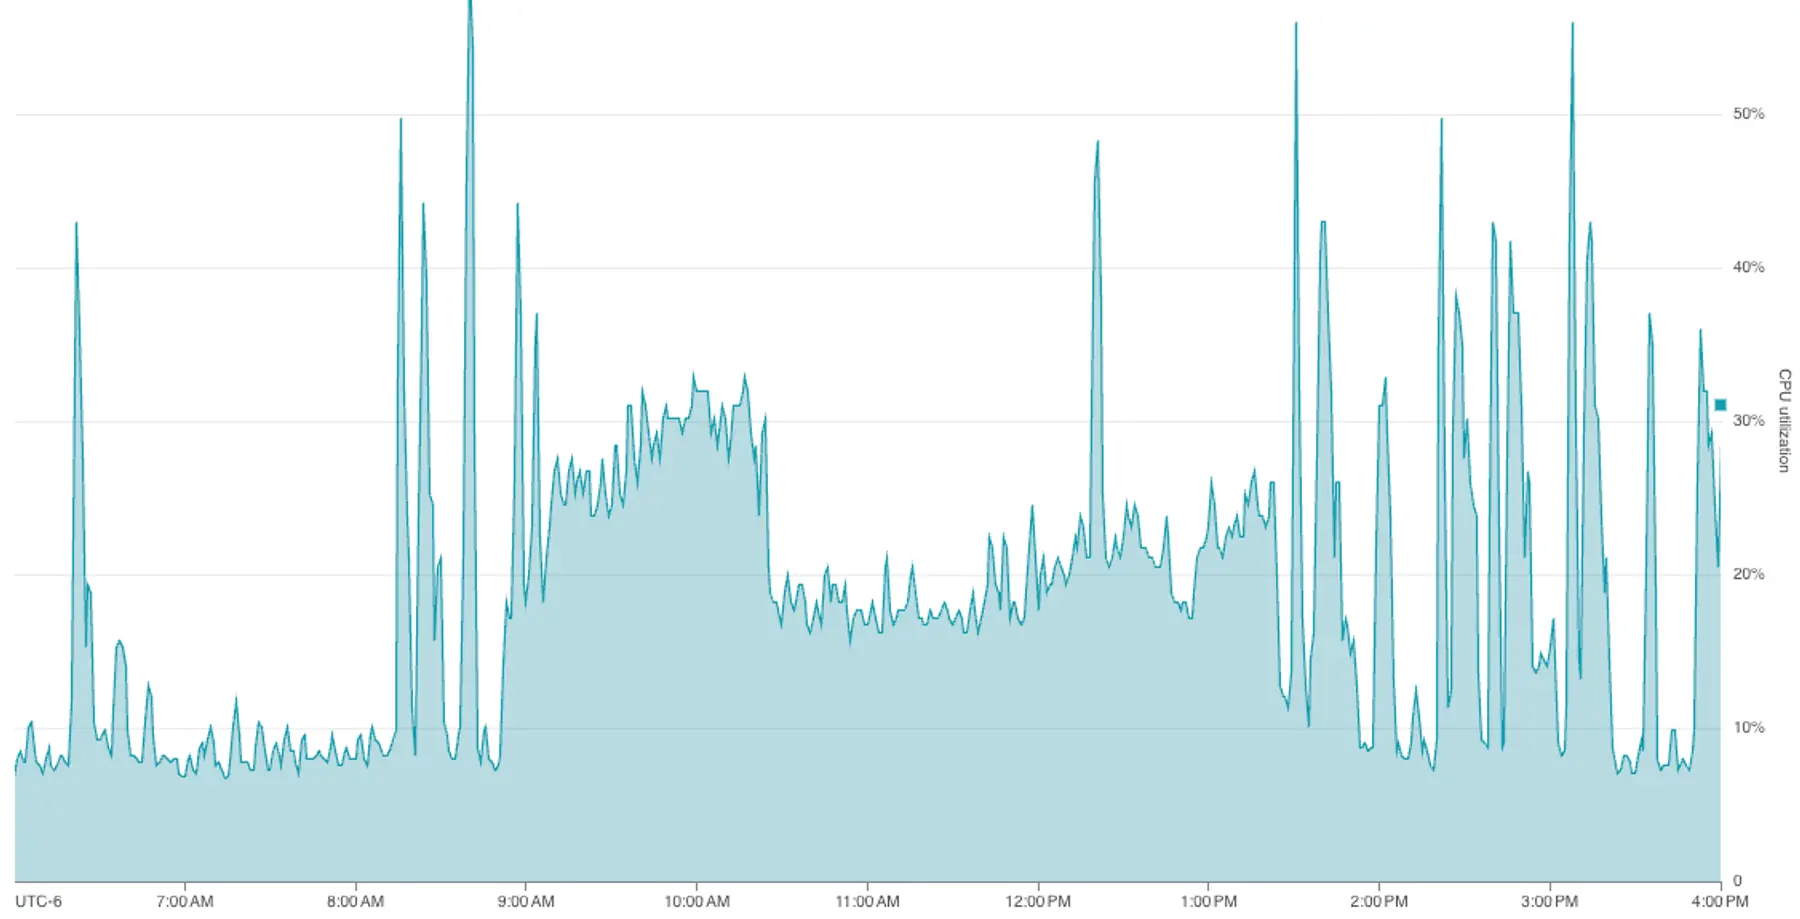
- Spiking memory and CPU usage: Graphs showed that around 8:30 that morning, free memory in the associated database dropped from a steady state of 20% to nearly 0%, while CPU utilization doubled.
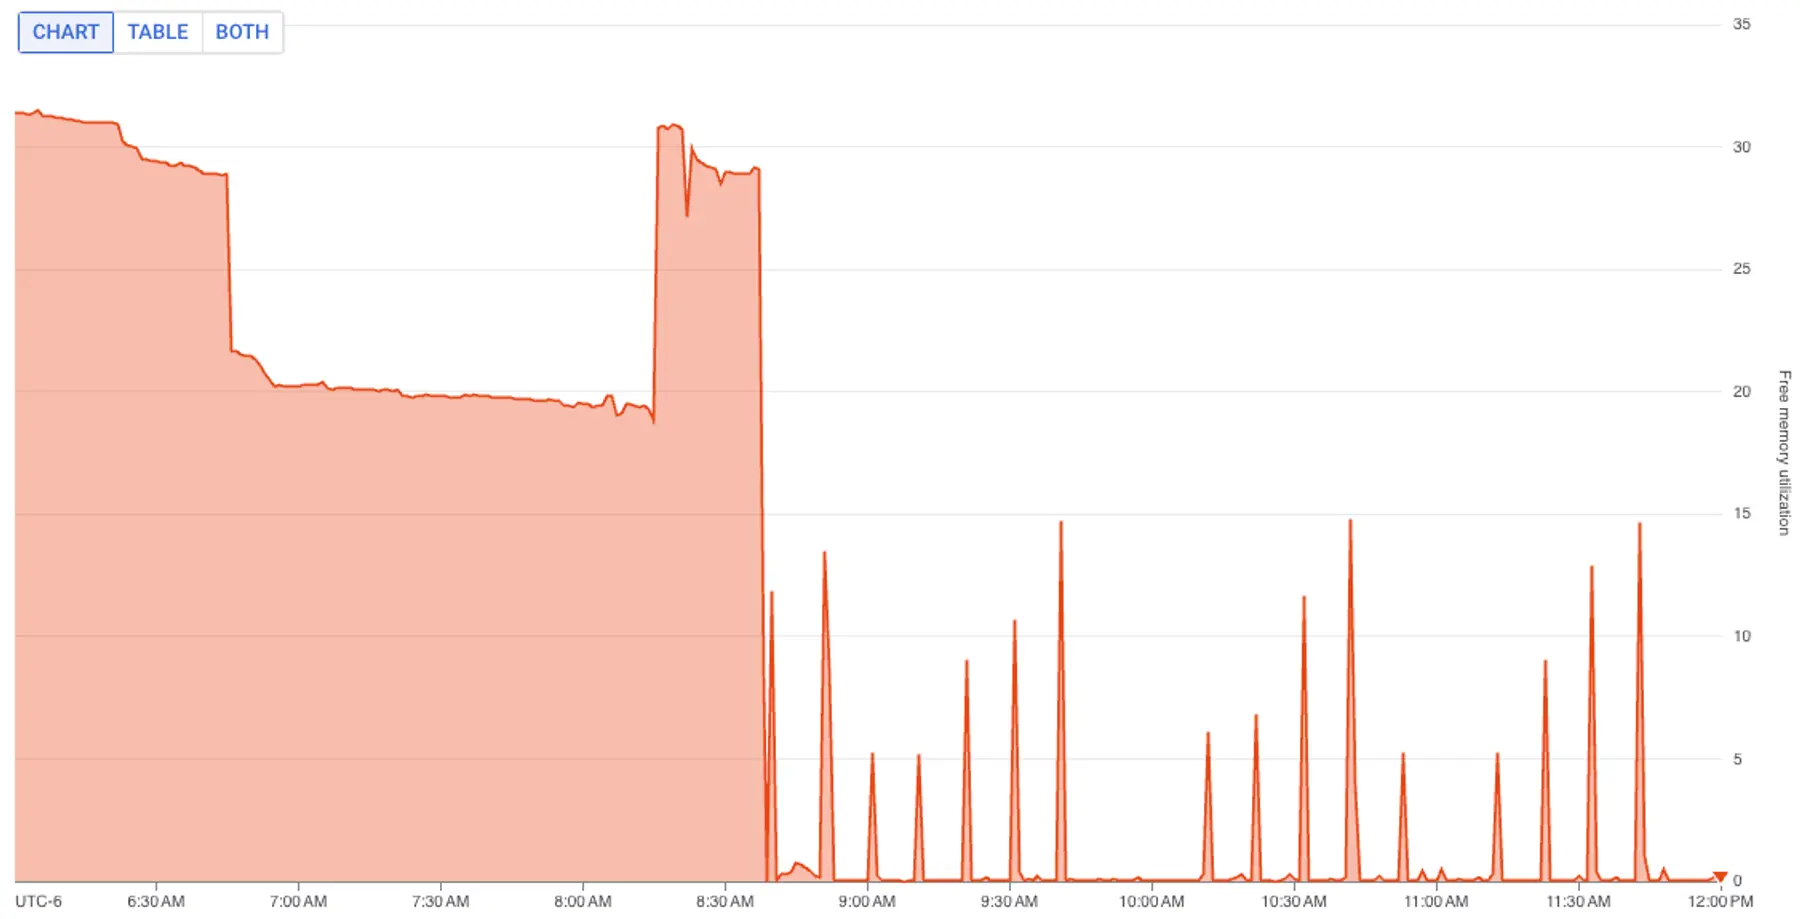
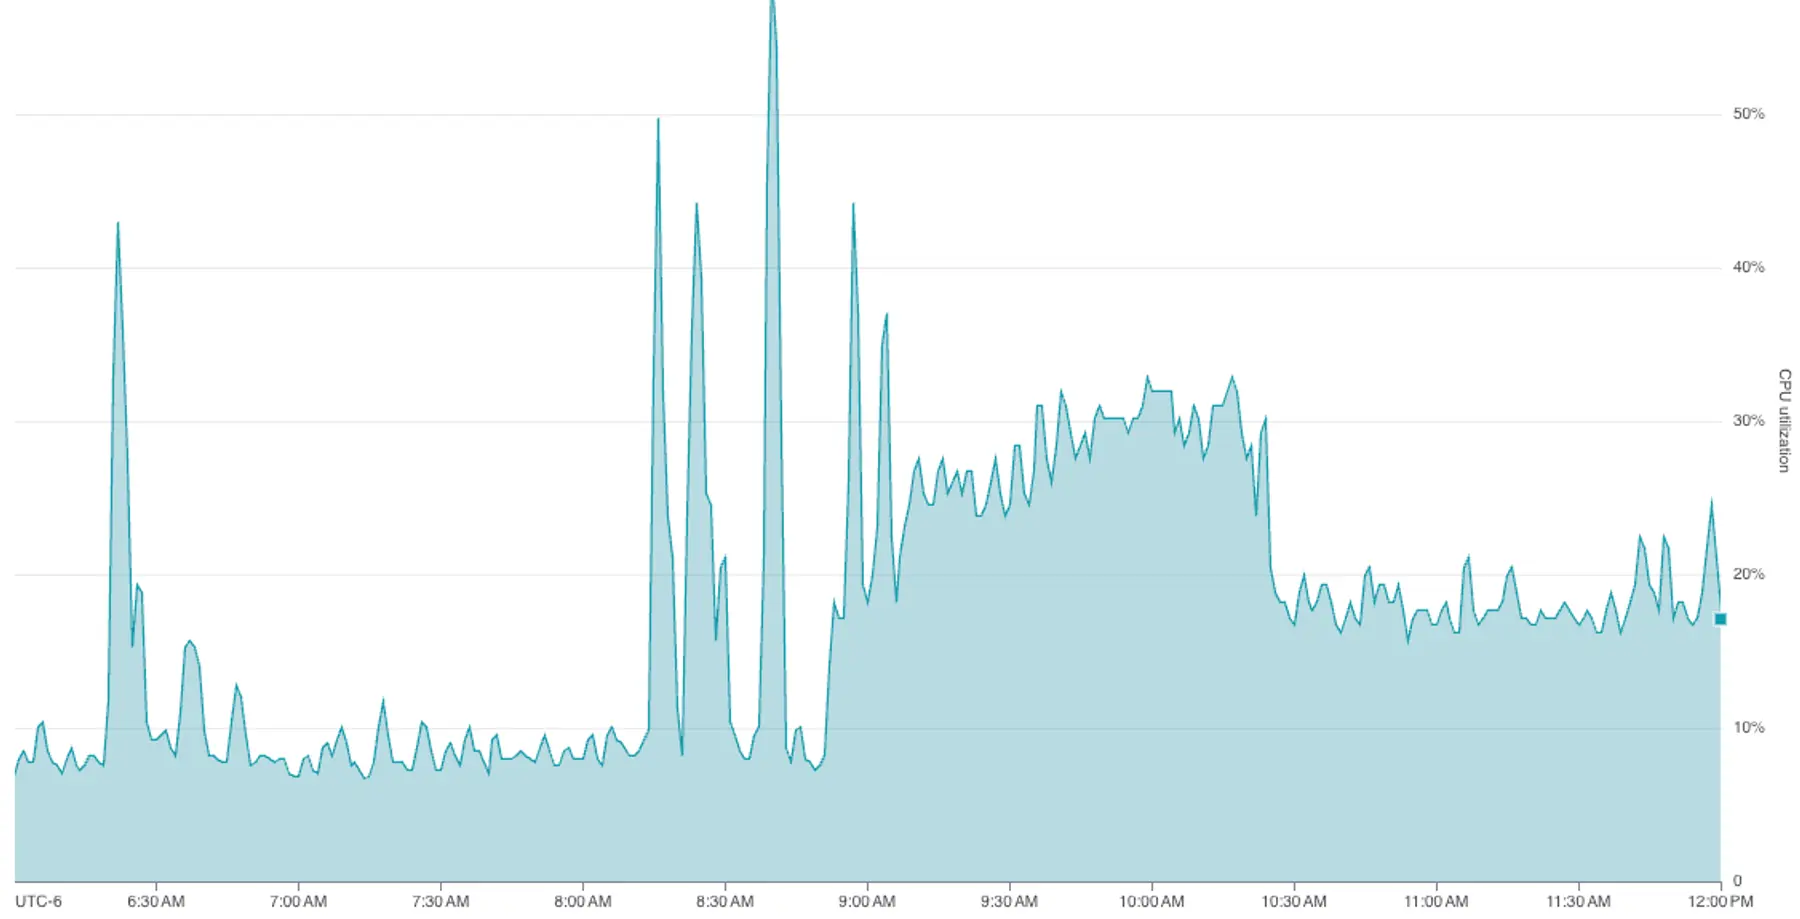
Spikes in resource usage often occur when more users do more work during business hours. However, this database lived in our staging environment, which has a small, stable set of users and use cases.
Thus, our first hypothesis was that a recent code change had caused a performance regression.
Hard evidence: a four-hour-old transaction
Of course, a code change was not the only possibility. We stepped back to survey the scene and gather more clues.
- Was it a problem with the environment itself? We logged into staging and manually ran a few basic operations. These operations worked.
- Was it a random problem, or predictable? We observed that the deployment pipeline always failed in the same way. Not all database queries were affected—it was always the migration stage that would hang. This reinforced our sense that the problem was localized.
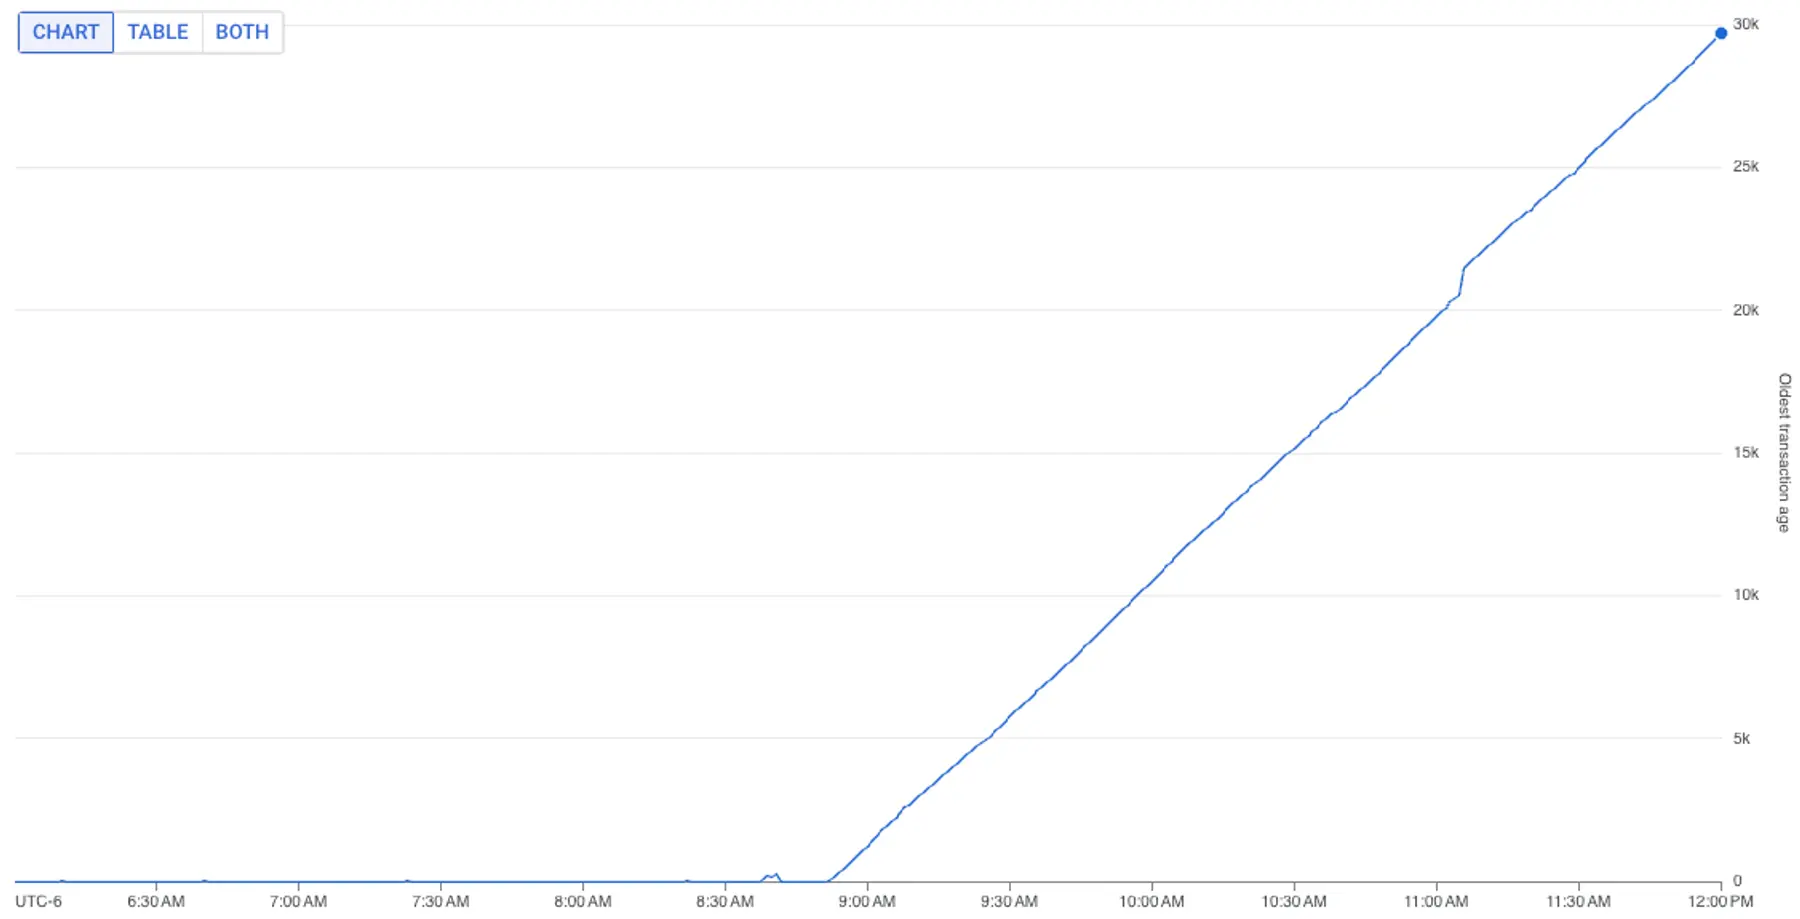
We scanned various charts in our internal metrics dashboard. One chart caught our attention: the age of the oldest open transaction.
Since around 8:30 AM, the age of the oldest open transaction had grown from single-digit seconds to over four hours.
In general, it’s best to keep transactions short. A longer transaction can be valid for specific use cases, but it wasn’t valid for us here. Nowhere in our platform did we expect a transactional unit of work to process data, or to sit idle, for hours.
Aside: Why open transactions can create problems
What’s bad about an open transaction? It can cause symptoms similar to a query that consumes a lot of CPU or memory.
An open transaction can:
- Block other queries that need the same locks: Long-running transactions may hold table or row-level locks. This can block concurrent queries that need to read or update the same rows, and schema update operations that need exclusive access to a catalog object.
- Lead to worse query performance across the board. This is a more insidious side effect. An open transaction can interfere with critical processes such as periodic autovacuum operations and concurrent index creation, both of which support efficient queries. Autovacuum operations help maintain query performance by removing old versions of rows that will never be returned, so new queries can scan only relevant rows.
- Cause a database to shut down unexpectedly. Vacuuming does much more than free up space from old rows. If vacuuming is blocked for too long, a PostgreSQL instance can suffer a transaction identifier wraparound failure, in which the instance shuts itself down to prevent critical data loss. If this happens, you need emergency manual intervention to get the instance running again.
pg_stat_activity finds a suspect
The four-hour-old transaction was a big clue. Now we wanted to figure out which query was causing this.
For this task, we revisited a trusted resource, the pg_stat_activity system view.
pg_stat_activity shows the activity of all current running processes on the database instance—both client backend processes as well as PostgreSQL-coordinated background processes. Using this view, we can easily find the set of workloads that are taking a long time to complete.
Here’s the query we ran:
This query returns metadata about each query that's been in the active state for over five minutes. We narrowed our search to active queries because we'd seen an increase in both CPU utilization and maximum transaction age, and thus suspected the long-lived query was not idle.
For this query, our results looked like this:
In this result set, we saw several long-running queries. The oldest query started around 8:40am—the time our database metrics started going wonky. This seemed to be our culprit:
However, this query looks innocuous. It has no tell-tale signs of trouble:
- It’s simple: it doesn’t have dozen-way joins, complex common table expressions that materialize large intermediate result sets, or window queries that slice-and-dice billions of rows.
- It’s indexed: We verified that both sides of the join condition seemed properly indexed on their respective tables.
- It’s bounded: The query has a
LIMIT 1to ensure it's not bringing back more data than needed.
At this point, a sensible theory could be that this culprit is a red herring and is itself blocked on another workload. We ruled out this hypothesis with two observations:
- First, this was the oldest recorded query actively running: it was unlikely another query was holding up its progress.
- Second, the “wait events” associated with the query showed that it was still fetching data from disk. In other words, the query was not blocked: it was actively doing work, just very slowly.
Now we had a prime suspect. But we needed to prove guilt.
pg_blocking_pids() proves guilt
This mystery began with hanging migrations. We now needed to prove this suspected query was preventing migrations from finishing.
At this point, we only knew the migration step in our staging pipeline had hung. We didn’t know which specific migration(s) had hung. In fact, we were a bit puzzled as to how migrations could be affected at all: the suspected query joins the events and postgres_dbs tables, but we hadn’t changed the schema for the events or postgres_dbs tables in our recent commits.
Our best friend pg_stat_activity once again came to the rescue.
We guessed the suspected query was holding a lock that was needed by a migration. So we queried pg_stat_activity to show all backend processes that are waiting on locks held by another backend process:
A few notes about this query:
- This query uses the
pg_blocking_pidsfunction to self-join active queries and pair blocked queries with their blocker. pg_blocking_pidsreturns the backend processes that hold a lock (or are closer to the front of the queue for a lock) that is needed by the blocked query.
This query produced the following results:
The results show that the suspected query blocks the following view creation statement:
On closer inspection, we see there’s a web of dependencies:
- The suspected query (
311124) is blocking two distinctCREATE OR REPLACE VIEWstatements (313674and344684). - One of the
CREATE OR REPLACE VIEWSstatements (313674) is blocking the other (344684).
It now made sense why migrations had hung:
- The view creation statement needed a lock on
postgres_dbs. Behind the scenes, aCREATE OR REPLACE VIEWstatement is implemented as aDROPof an existing view, followed atomically by the creation of the view as defined in the statement. This operation requires an exclusive lock on the view, because the view can't be altered if another transaction is actively reading it. - But
postgres_dbswas being read by the suspected query. For as long as the suspected query ran (four hours and counting), the view creation statements wouldn’t be able to get an exclusive lock onpostgres_db. - Multiple deploy failures led multiple view creation statements to pile up. We had been failing and re-attempting deploys to our staging environment for hours. On each attempt, a new view creation statement had been initialized, which explained the multiple distinct view creation statements we saw.
The suspected query was now the guilty query. But there remained a big question: where had this query come from?
Finding the source of the guilty query
We had to find who had issued the guilty query. If our application or a cron job had issued it, the same problem could arise in production.
We began by searching our code.
We make heavy use of GORM, a Go object-relational mapper and query building library, in our backend. Unfortunately, this makes it difficult to search for exact query text and find its source. After a deep search of the package that queries our Event model, we didn’t find any code that builds this query. We began to think this query was issued from outside of our application.
At this point, we realized… if we'd tweaked our queries to pg_stat_activity earlier, we could have short-circuited this question entirely. In particular, we would have requested the following columns:
usename: the name of the user that issued the statement.application_name: a free-form tag used to identify the source application of a database client. For application clients, this value is empty by default, but you can (and should) supply it via the database connection string (e.g.,postgres://myuser@my-host:5432/mydb?application_name=myapp). For clients that connect to the database instance directly via a shell, theapplication_namevalue is usually the name of the tool (e.g.,psqlorpgcli).
We re-issued a query to pg_stat_activity to get these two columns for our guilty query. The results showed the guilty query had been issued via a psql shell by <REDACTED_PERSON>@render.com.
The root cause was an ad-hoc query against our staging database from an engineer!
The engineer had been working on a feature related to tracking PostgreSQL events, and they had issued the query to validate that a type of event data existed. They’d seen the query was taking a while to finish, so they hit Ctrl+C in their psql shell to cancel the query, and went about their day.
Unfortunately—and very unintuitively—canceling a psql query only cancels reading the query. The client backend on the PostgreSQL instance continues to execute the query. Unknowingly, the engineer had issued a background process that had run for over four hours.
Quick fix: killing the query
Now that we knew the long-running query was a one-off, we moved on to unblocking the pipeline.
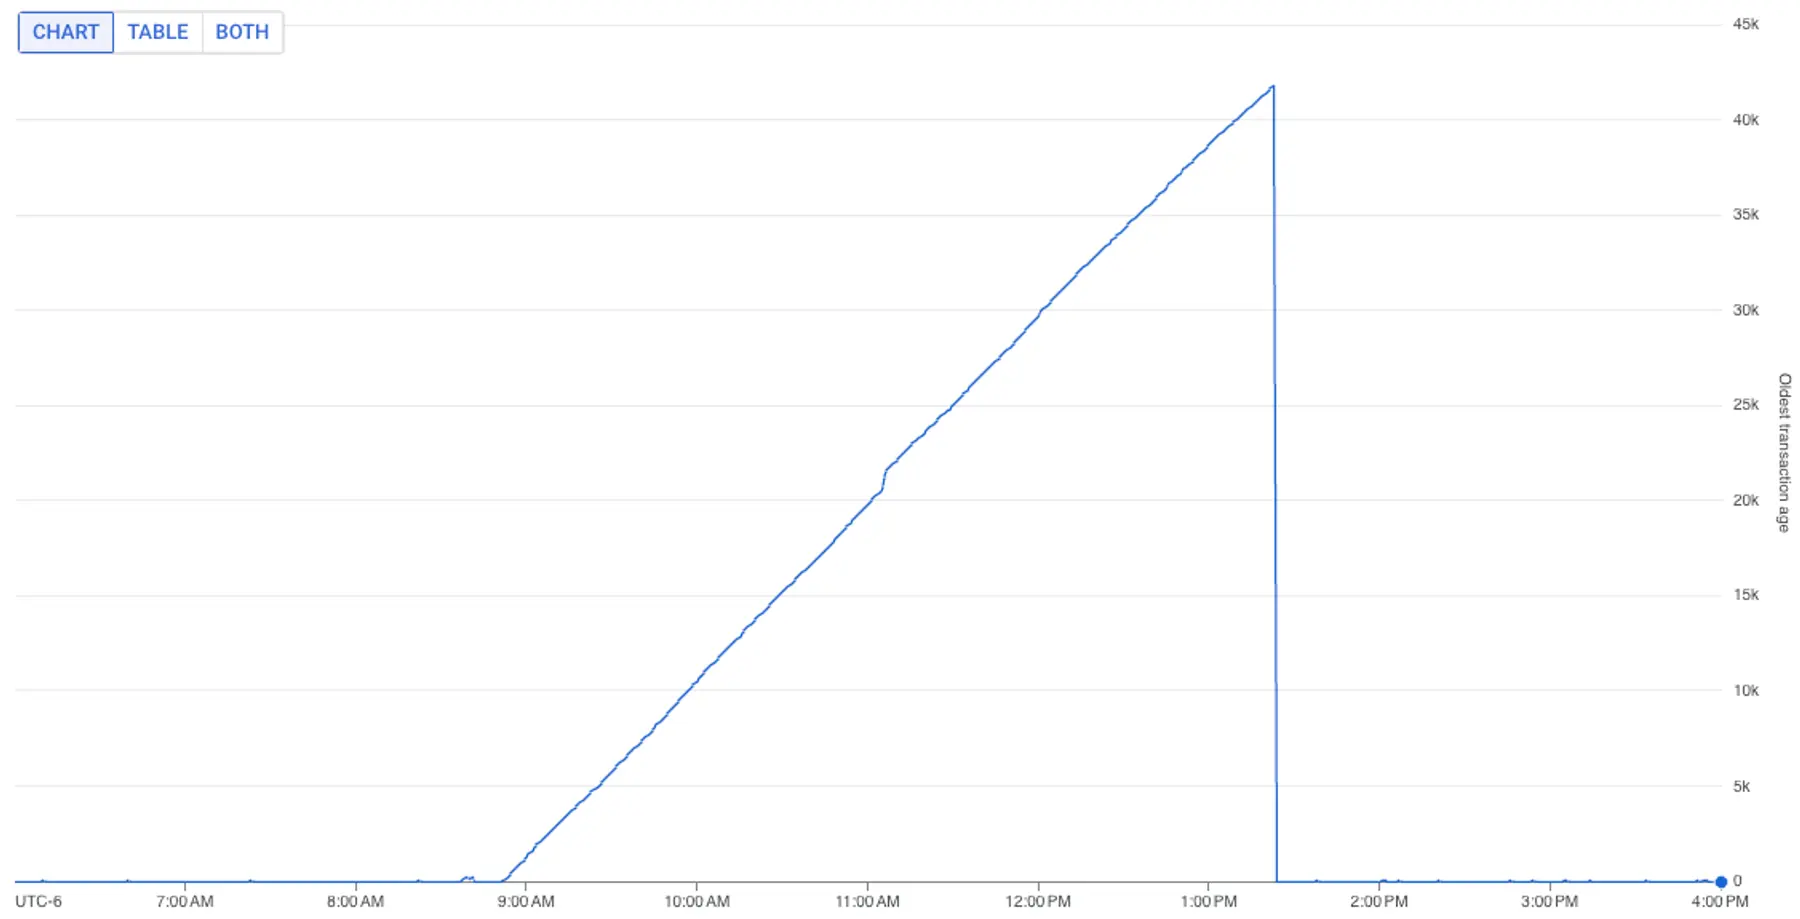
We simply killed the long-running query:
Almost immediately, our migration step passed without failure, and the elevated metrics we noted began to normalize.
Mystery solved.
Next mystery: Why so slow?
Or rather, mystery partially solved.
One big question remained: why did this query take so long? Without this understanding, we might unwittingly write another query that triggers the same problem.
Up until this point, our tools pg_stat_activity and pg_blocking_pids() helped us understand active problems within our database. To investigate the core issues with the query itself, we needed other tools.
In fact, this investigation became a whole adventure in of itself… an adventure that deserves its own story.
Next:
- Try running the queries you just read about. You can find them in our PostgreSQL performance troubleshooting guide.
- Then, learn how we debugged this slow query in Part 2: From slow query to fast—via stats.