Debugging infrastructure at scale is rarely about one big aha moment. It’s often the result of many small questions, small changes, and small wins stacked up until something clicks.
Inside the hypercube of bad vibes: the namespace dimension
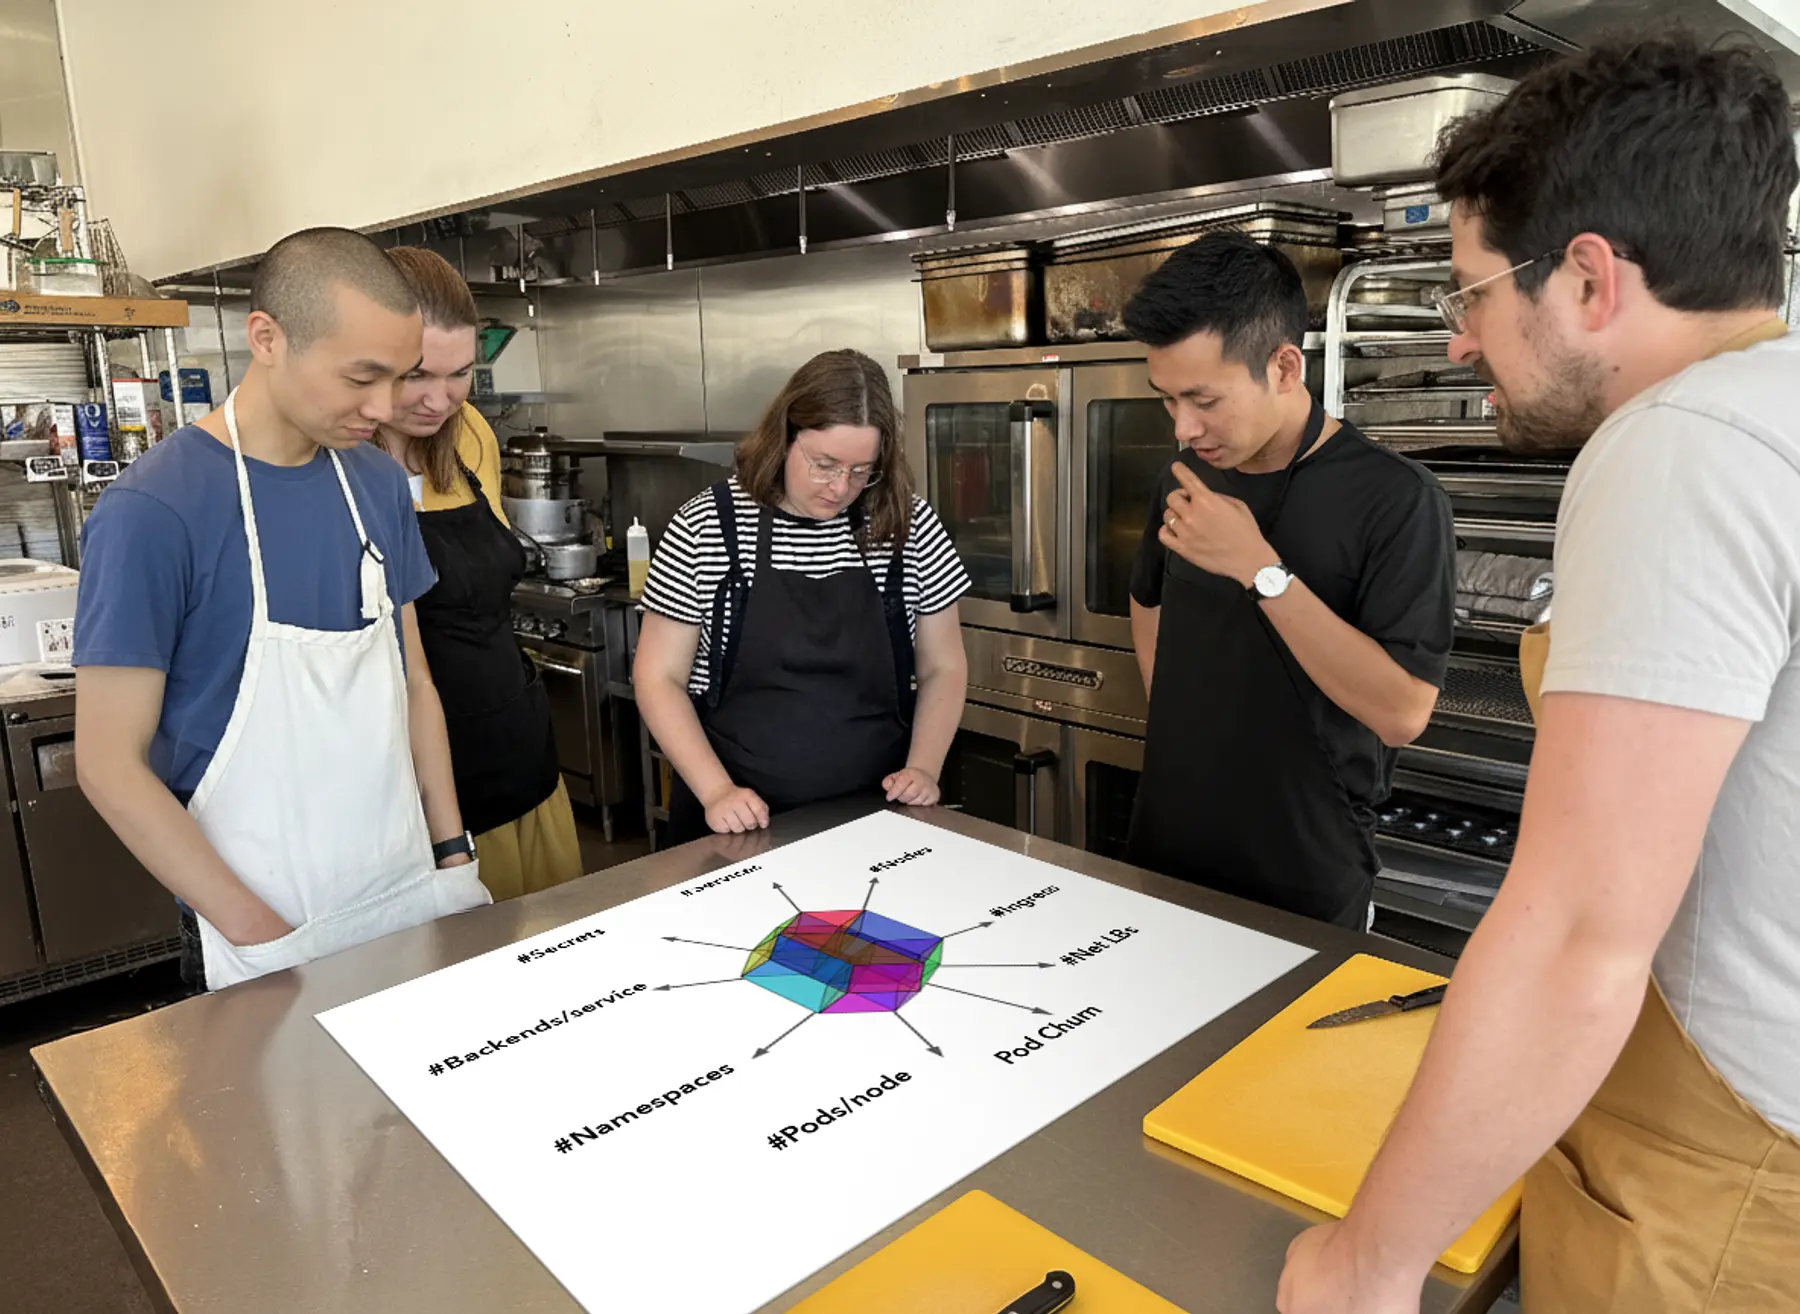
Plenty of teams run Kubernetes clusters bigger than ours. More nodes, more pods, more ingresses, you name it. In most dimensions, someone out there has us beat.
There's one dimension where I suspect we might be near the very top: namespaces. I say that because we keep running into odd behavior in any process that has to keep track of them. In particular, anything that listwatches them ends up using a surprising amount of memory and puts real pressure on the apiserver. This has become one of those scaling quirks you only really notice once you hit a certain threshold. As this memory overhead adds up, efficiency decreases: each byte we have to use for management is a byte we can't put towards user services.
The problem gets significantly worse when a daemonset needs to listwatch namespaces or network policies (netpols, which we define per namespace). Since daemonsets run a pod on every node, each of those pods independently performs a listwatch on the same resources. As a result, memory usage increases with the number of nodes.
Even worse, these listwatch calls can put significant load on the apiserver. If many daemonset pods restart at once, such as during a rollout, they can overwhelm the server with requests and cause real disruption.
Following the memory trail
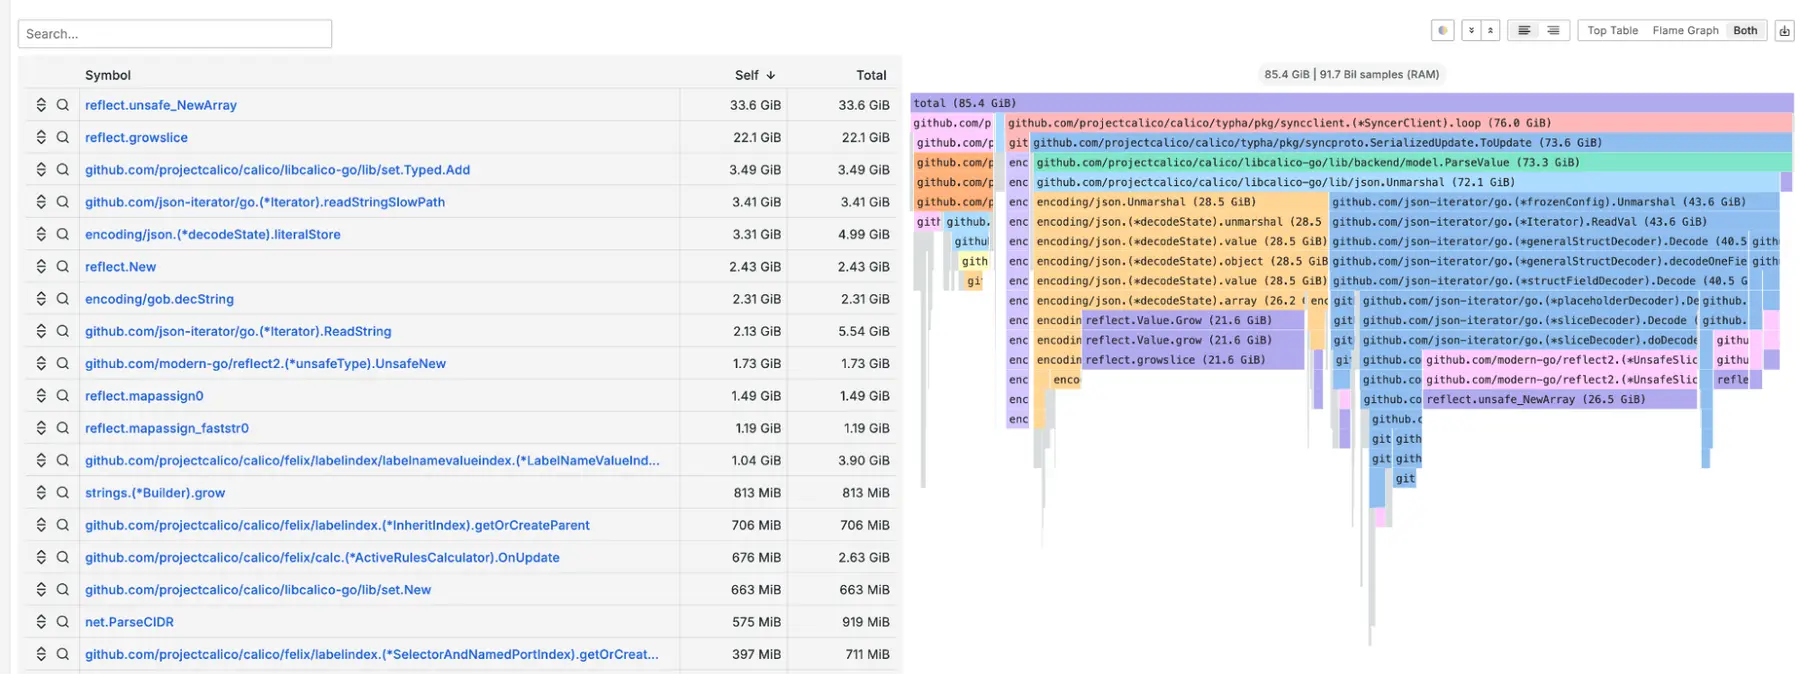
A few months ago, if you looked at our nodes, the largest memory consumers were often daemonsets. In particular, Calico and Vector which handle configuring networking and log collection respectively.
We had already done some work to reduce Calico’s memory usage, working closely with the project’s maintainers to make it scale more efficiently. That optimization effort was a big win for us, and it gave us useful insight into how memory behaves when namespaces scale up.
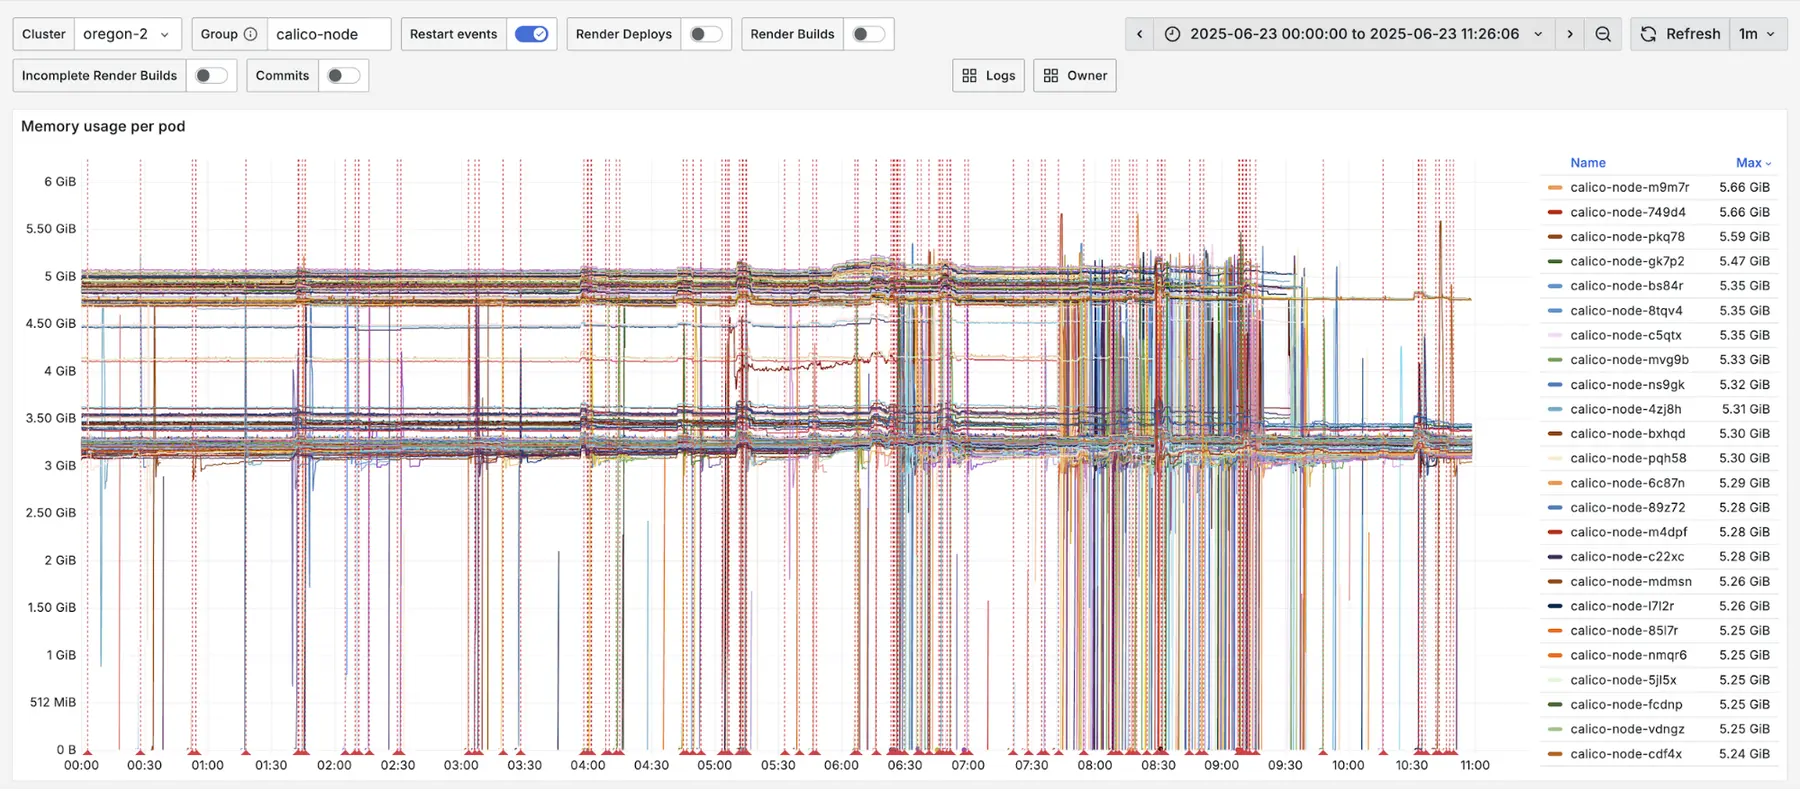
To support that work, we set up a staging cluster with several hundred thousand namespaces. We knew that per-namespace network policies (netpols) were the scaling factor that stressed Calico, so we reproduced those conditions to validate our changes.
While running those tests, we noticed something strange. Vector, another daemonset, also started consuming large amounts of memory.
The pattern looked familiar, and we knew we had another problem to dig into. Vector obviously wasn’t looking at netpols but after poking around a bit we found it was listwatching namespaces from every node in order to allow referencing namespace labels per-pod in the kubernetes logs source.
Do we really need these labels?
That gave us an idea: what if Vector didn’t need to use namespaces at all? Was that even possible?
As it turns out, yes, they were in use in our configuration, but only to check whether a pod belonged to a user namespace.
Conveniently, we realized we could hackily describe that condition in another way, and the memory savings were absolutely worth it.
Building the fix (and breaking the logs)
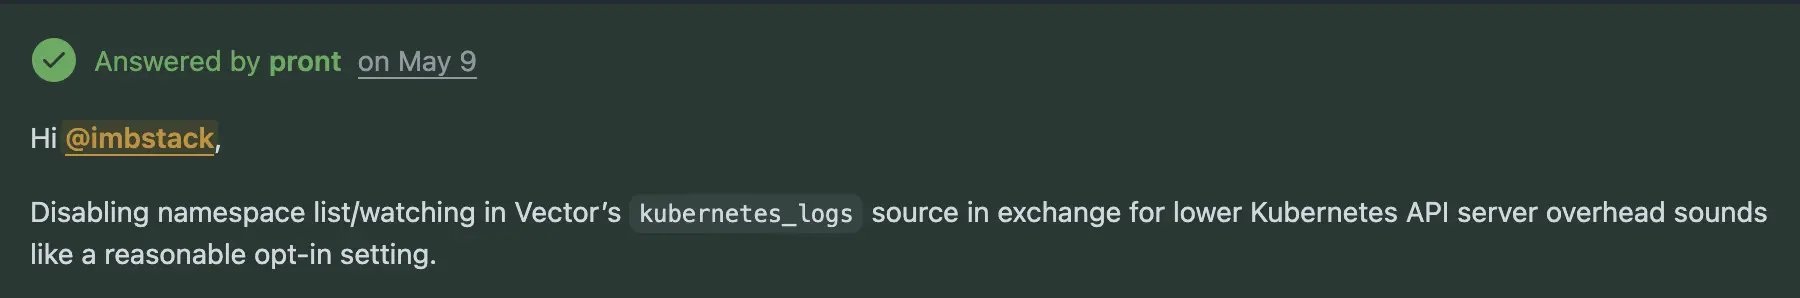
At that point, we were feeling a bit too lucky. We reached out to the Vector maintainers to ask whether disabling this behavior would actually work, and whether they would be open to accepting a contribution if we made it happen.
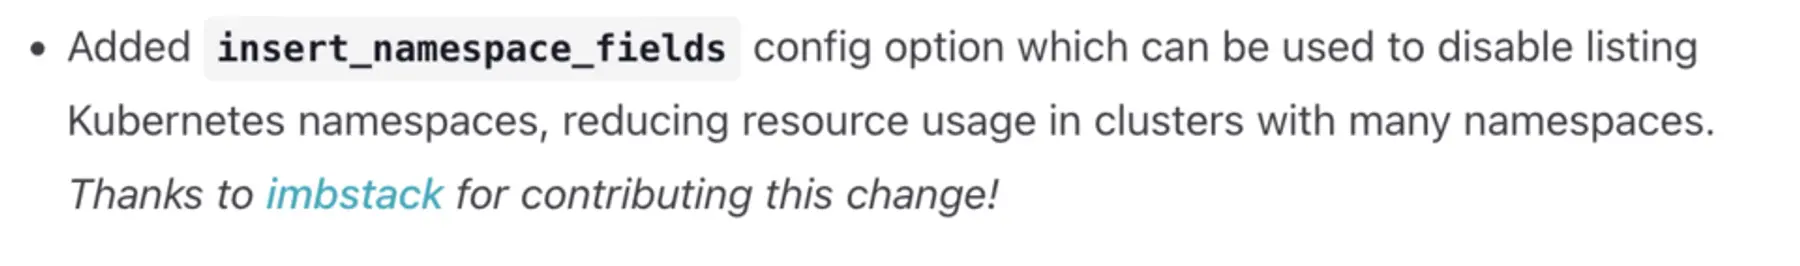
From there, all that was left was to try it. The code change was straightforward. We added a new config option and threaded it through the relevant parts of the codebase.
After a few hours of flailing at rustc, a Docker image finally built and we were ready to test the theory. The container ran cleanly with no errors in the logs, which seemed promising.
But then we hit a snag. Nothing was being emitted. No logs at all. I couldn’t figure out why.
Thankfully, our pal Claude came to the rescue:


The numbers don’t add up
The change saved 50 percent of memory. A huge win. We were ready to wrap it up and ship to production.
But then Hieu, one of our teammates, asked a very good question.
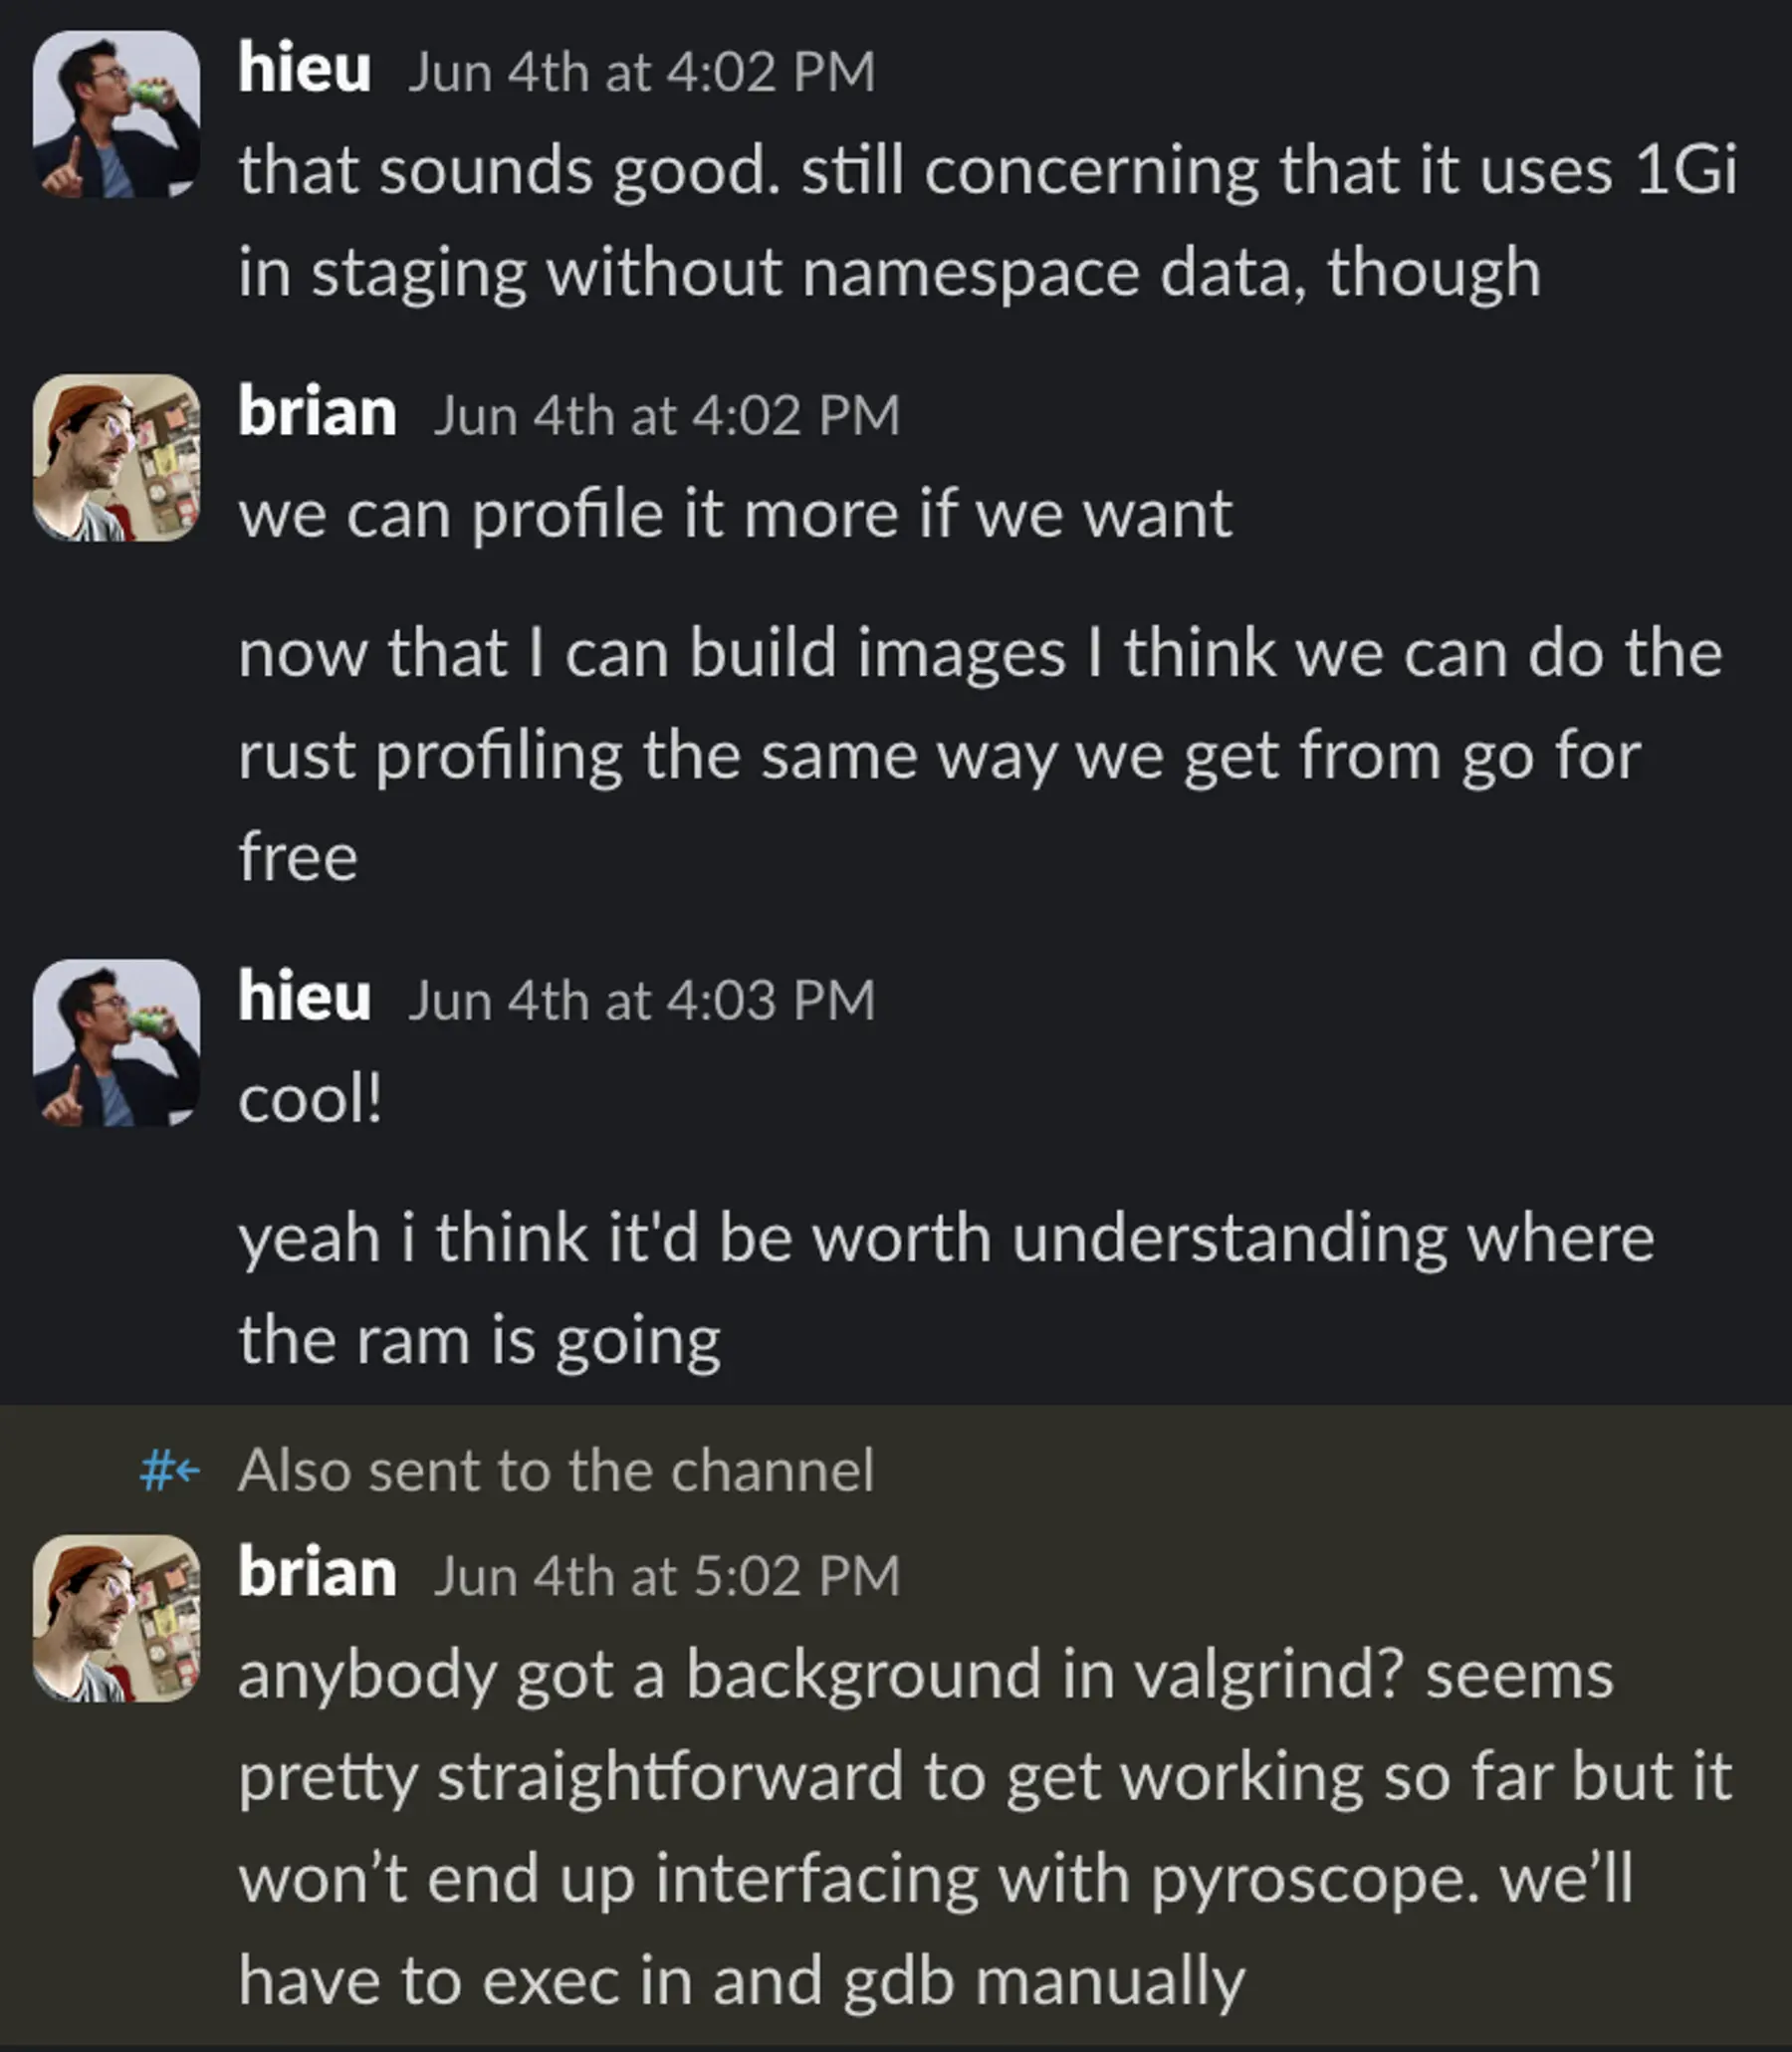
He was right, something didn’t add up.
A few hours later, after repeatedly running my head into a wall, I still hadn’t found anything. There was still a full gibibyte of memory unaccounted for. My whole theory about how this worked was starting to fall apart.
I even dropped into the channel to see if anyone had Valgrind experience:
Me (later in channel): anybody got a background in valgrind? seems pretty straightforward to get working so far but it won’t end up interfacing with pyroscope. we’ll have to exec in and gdb manually.
The answer was no.
In a last-ditch effort to profile it again, I finally saw the answer. It had been staring me in the face the whole time.
We actually had two kubernetes_logs sources on user nodes. I had only set the flag on one of them. Once I applied it to both, memory usage dropped to the level we had seen in staging before the extra namespaces were added.
Shipping it
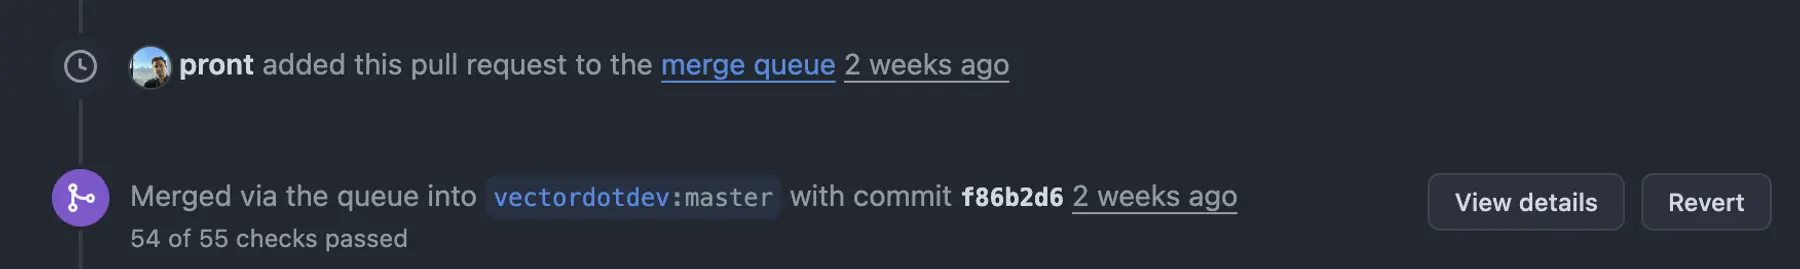
I put together a full pull request, and after waiting a little while, it shipped!
Around the same time, our colleague Mark happened to be on-call. He did his usual magic — pulled everything together, tested the rollout in staging, and got it shipped to production.
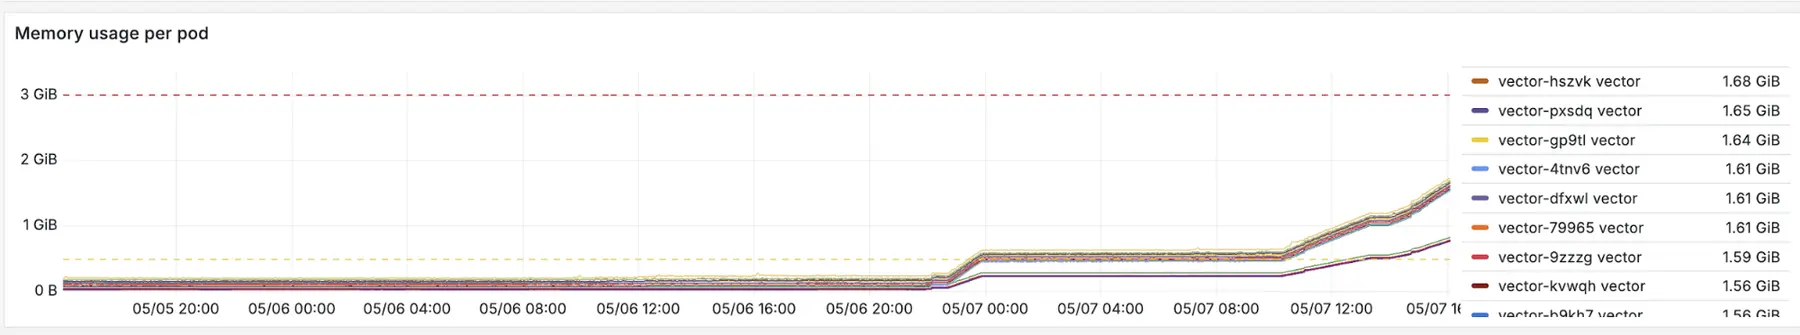
I’ll let the results speak for themselves. 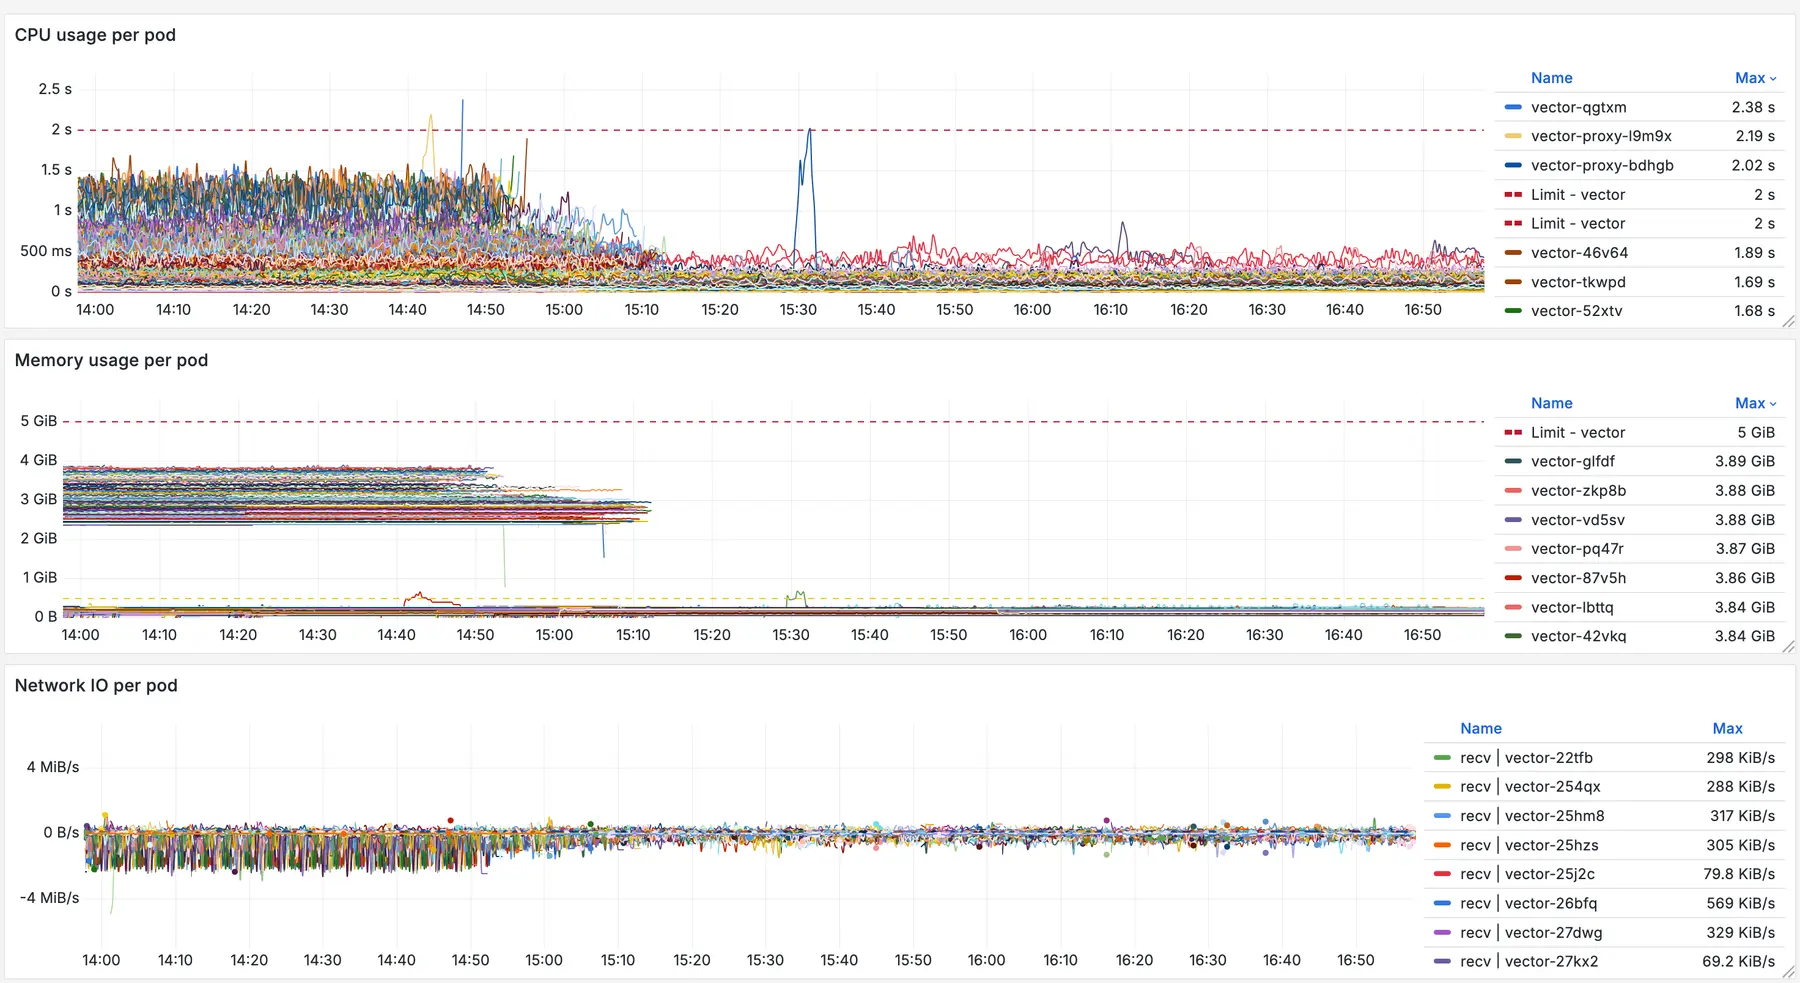
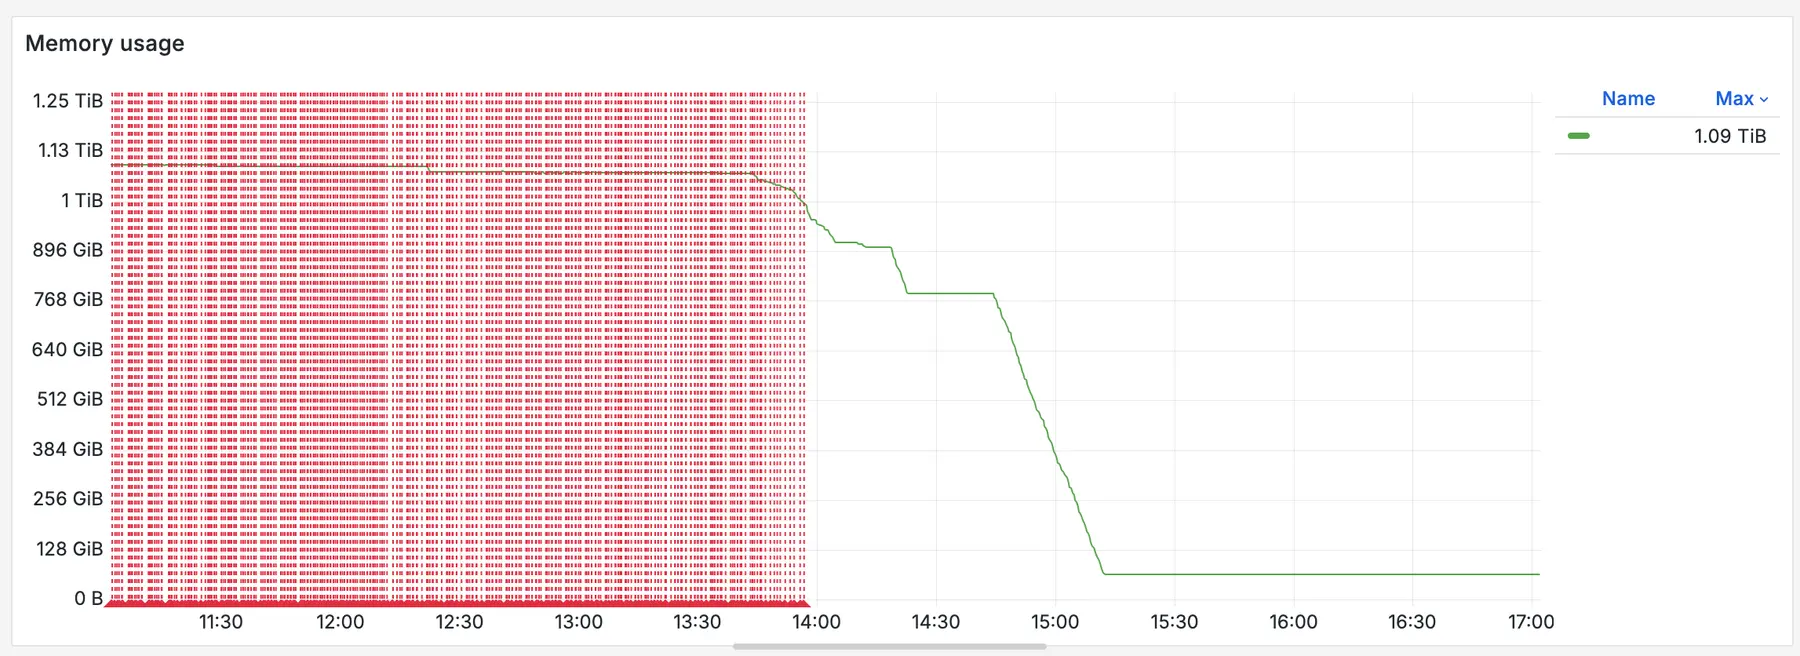
7 TiB later
Debugging infrastructure at scale is rarely about one big “aha” moment. It’s often the result of many small questions, small changes, and small wins stacked up until something clicks.
In this case, it started with a memory chart that didn’t look quite right, a teammate asking the right question at the right time, and a bit of persistence. When applied to our whole infrastructure, that simple fix freed up 7 TiB of memory, reduced risk during rollouts, and made the system easier to reason about.
Huge thanks to Hieu for pushing the investigation forward, Mark for shipping it smoothly, and the Vector maintainers for being responsive and open to the change.
If you’re running daemonsets at scale and seeing unexplained memory pressure, it might be worth asking:
Do you really need those namespace labels?