I was pretty excited when I discovered Telnet back in the 90s. I could access a command line on servers all over the college campus from my tiny dorm room! I no longer had to trudge through feet of snow and frigid temperatures (I went to college in the U.S. state of Maine) only to find all the computers in the lab occupied. I could connect to them from my room -- even if someone else was already using them!
A more advanced version of me is now shocked at how pervasive the unencrypted Telnet protocol was in the 90s. Back then, I didn't even consider encrypting terminal traffic. Fortunately, others did. After discovering a password sniffer had been used on his university’s network, Finnish student Tatu Ylönen created the first version of the Secure Shell Protocol (or SSH) in 1995, and its use has grown continuously since.
SSH is powerful because it can be used not only to get a command line on a remote computer but also to securely encapsulate almost any kind of data flowing between two machines. It can tunnel pixels from a remote machine's X11 server, sync files with rsync, and even mount a filesystem from a remote machine using SSHFS. SSH has understandably become an essential tool in the software developer's toolkit.
We recently announced the ability to SSH into your Render services, so I was excited to see how I could use it to improve my development workflow.
Why SSH?
We primarily built SSH on Render to allow you to get a command line in containers running a service you’ve deployed. We don’t recommend using it in production regularly, but it can be helpful in a pinch, to run a database migration after a deployment or to check the contents of a file being written to disk.
But there’s a lot more you can do with SSH. For example, you can use scp to copy files to or from your service’s persistent disk. For my own needs, I was curious if I could use Render SSH for port forwarding and eventually remote debugging.
Some of the most frustrating bugs I’ve encountered are those I can’t reproduce locally. I get a bug report from a user along with instructions to reproduce it. I can reproduce the bug in production (running Linux) but surprisingly can’t reproduce it on my Mac. How do I investigate and fix a bug if I can’t reproduce it on my development machine?
Debug Node.js Remotely
Remote debugging to the rescue! Here’s the code for a simplified Node.js HTTP server I will debug remotely.
As a refresher, to attach a debugger to the node process if it were running locally, I’d start node with the --inspect flag and then attach VS Code (or one of several other debugger clients) to the process.
Now VS Code would show me variable values and the call stack at any point during the program’s execution.
But getting this working when the node process is running on Render is not as straightforward. Render accepts traffic from the public internet for only one port for a Web Service. My Web Service is already listening on port 10000 for HTTP traffic, so I can’t expose the debug port publicly. Moreover, even when Render starts supporting traffic on multiple ports, exposing the debug port publicly is unsafe! Fortunately, the Node.js documentation provides guidance on enabling remote debugging safely.
Configure Render
The first step is to edit the Start Command for the service from the Render Dashboard. Instead of running node server.js, I have to run node --inspect=9229 server.js. 9229 is the default port the Node.js debugger will listen on, but I want to be explicit to avoid confusion. Then I add an SSH key to my Render account. This only needs to be done once for each Render account.
While the service restarts with the new start command, I’m going to configure VS Code.
Configure VS Code
VS Code requires a launch.json configuration file to connect to the node process as a debug client. To create this, open .vscode/launch.json (create this folder and file if needed) and click Add Configuration… in the bottom right.
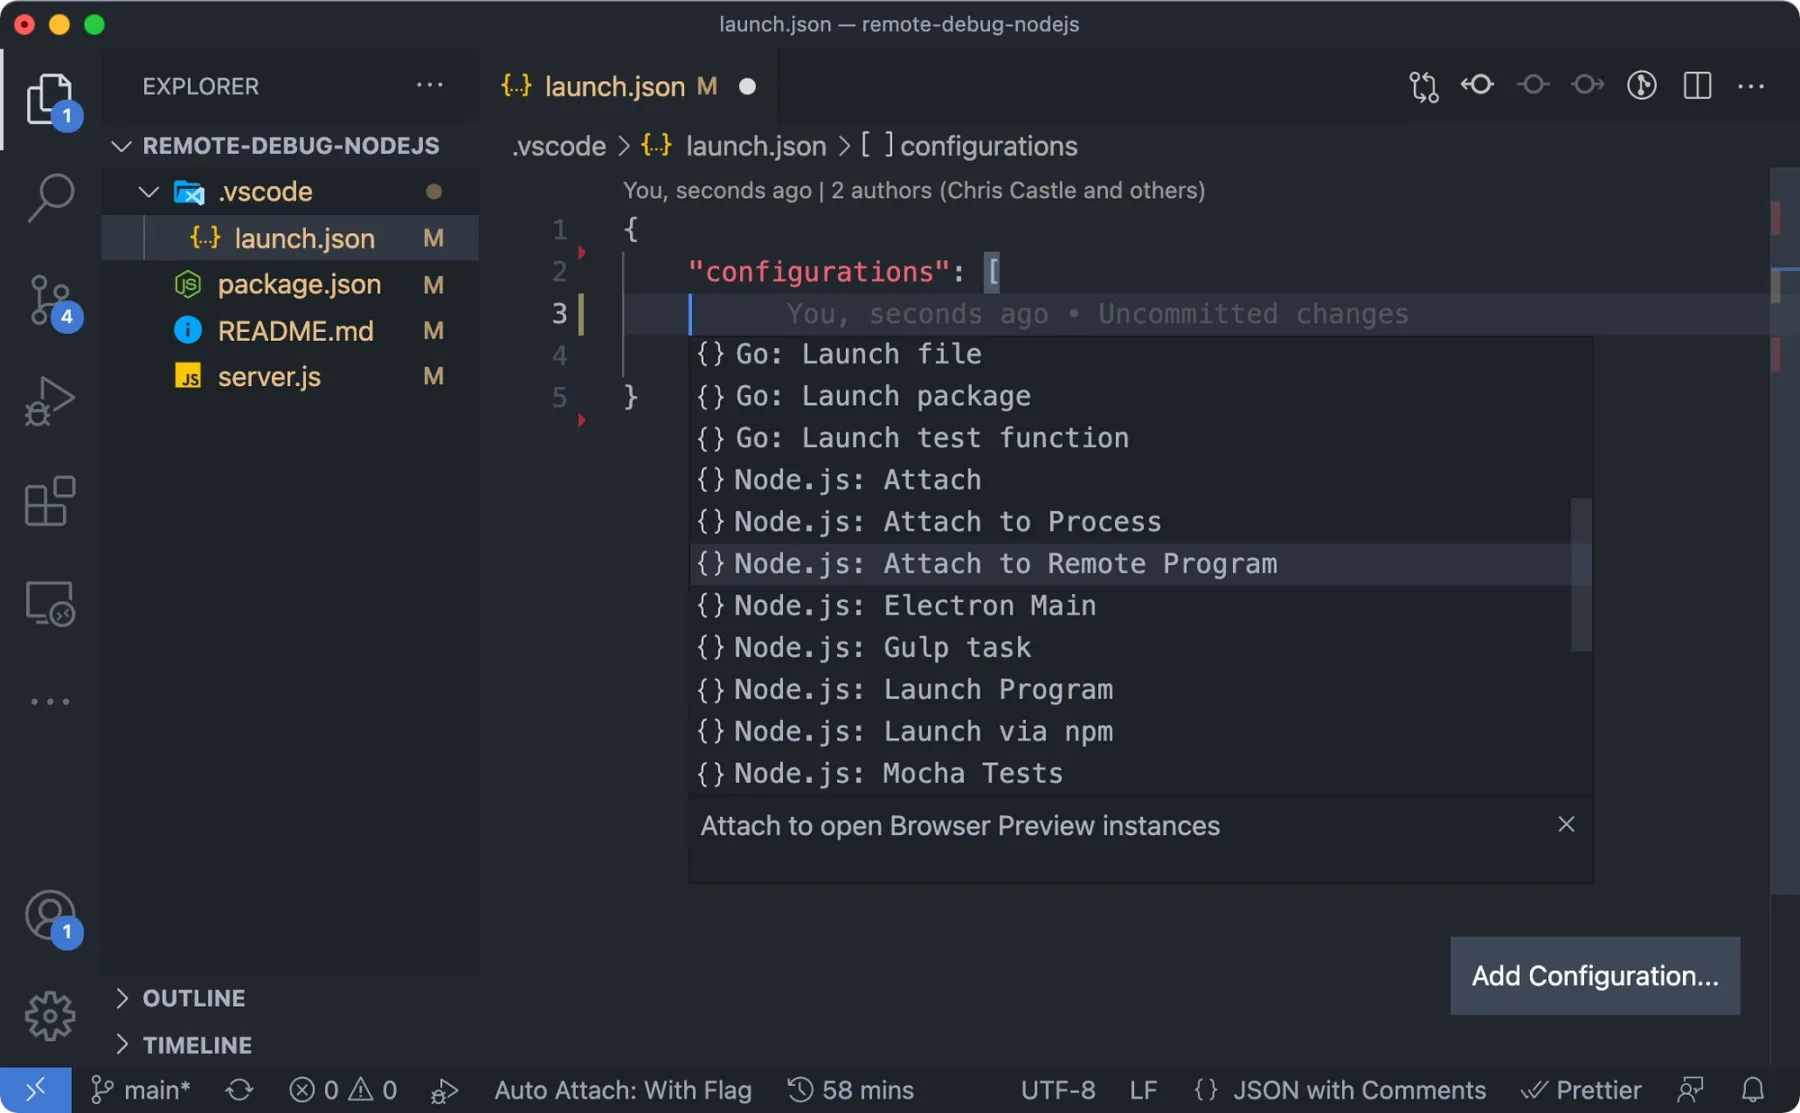
Select Node.js: Attach to Remote Program, and VS Code will generate a template with some values that need to be filled in. The address and port are where VS Code will try to connect to the node process, and the remoteRoot is the directory to which code is deployed on Render. This path won’t change if you’re using the native Render Node environment instead of Docker. Here is the launch.json I used.
Create the SSH Tunnel
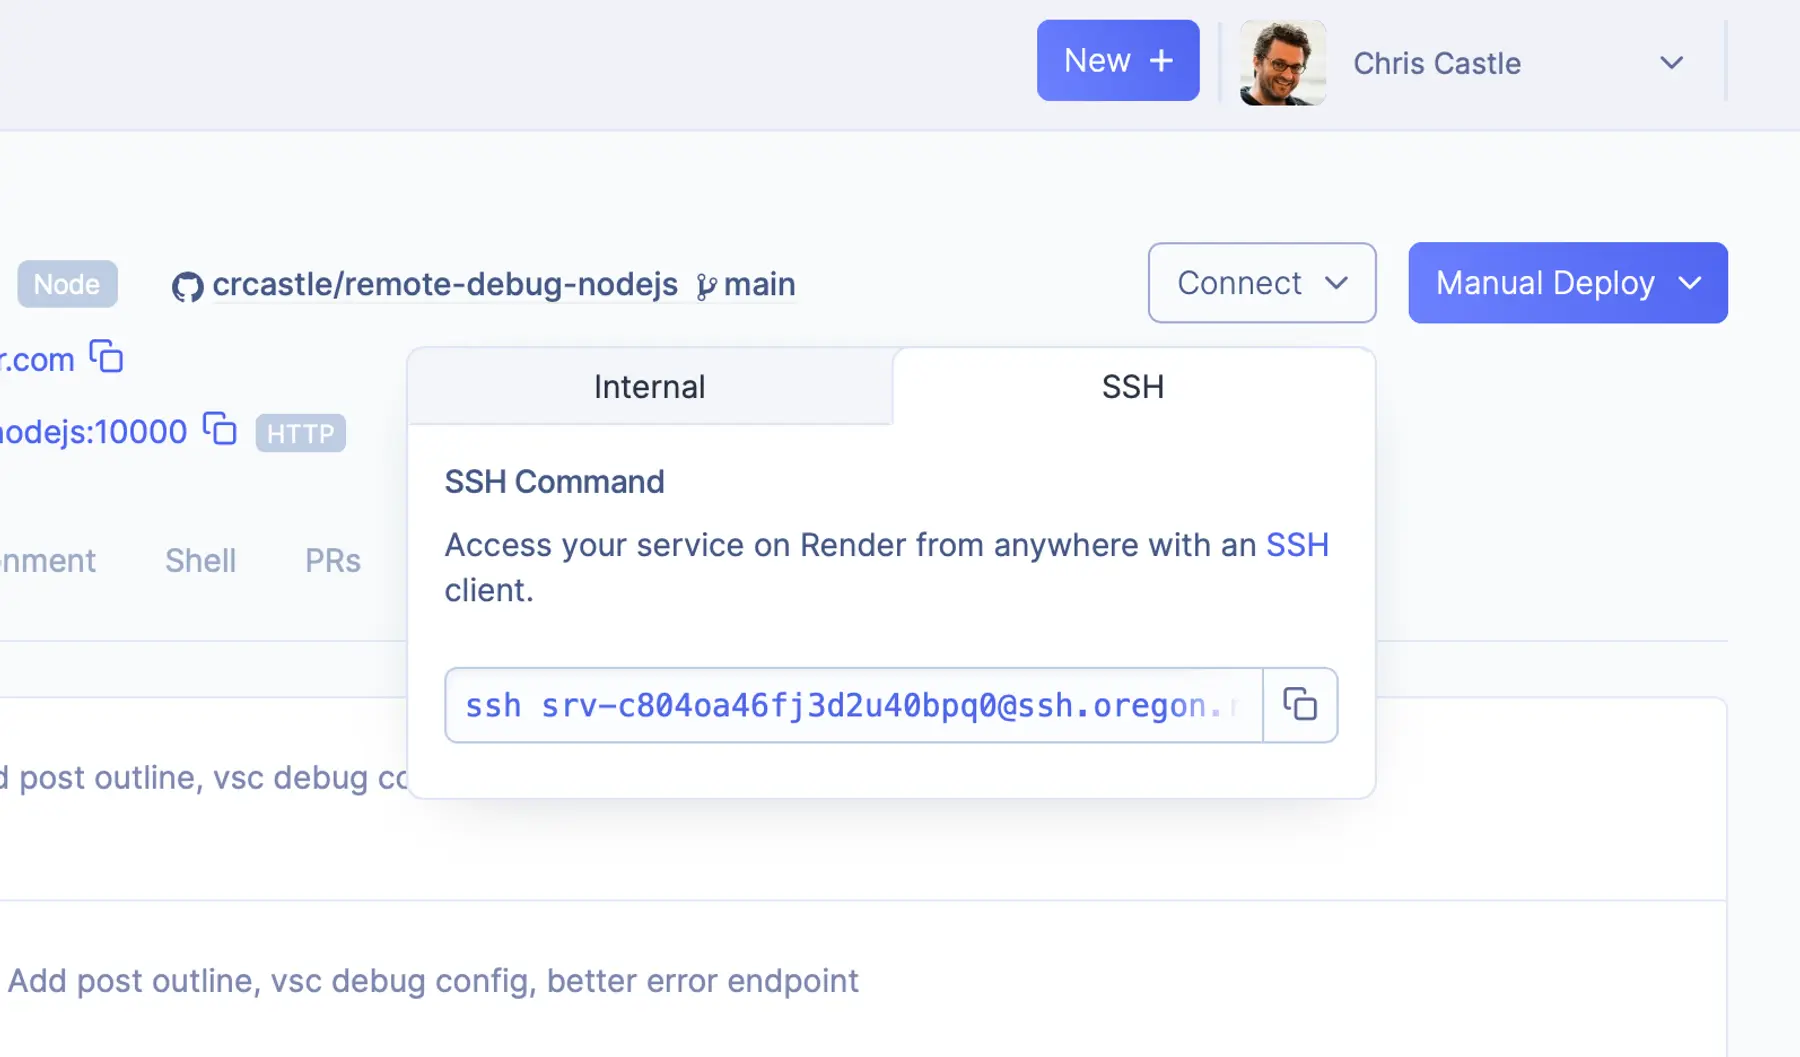
Now that the Web Service is using the new Start Command, I can create an SSH tunnel between the node process running on Render and my local development machine. First I grab the ssh command for my Web Service from the Render Dahsboard.
I need to modify it so that ssh creates a tunnel between two ports instead of giving me a command line.
- The
-Nflag tellssshto not execute a remote command after establishing the connection. Normally when yousshinto a machine, a command likebash1 is run. I don’t need that because I only wantsshto forward TCP traffic back and forth. - The
-Lflag instructssshto create a tunnel for TCP traffic such that connections to port9229on my local machine are forwarded tolocalhost:9229on the remote machine. - Finally,
srv-c804oa46fj3d2u40bpq0@ssh.oregon.render.comis the username and domain namesshwill use to create the connection.
Start Debugging
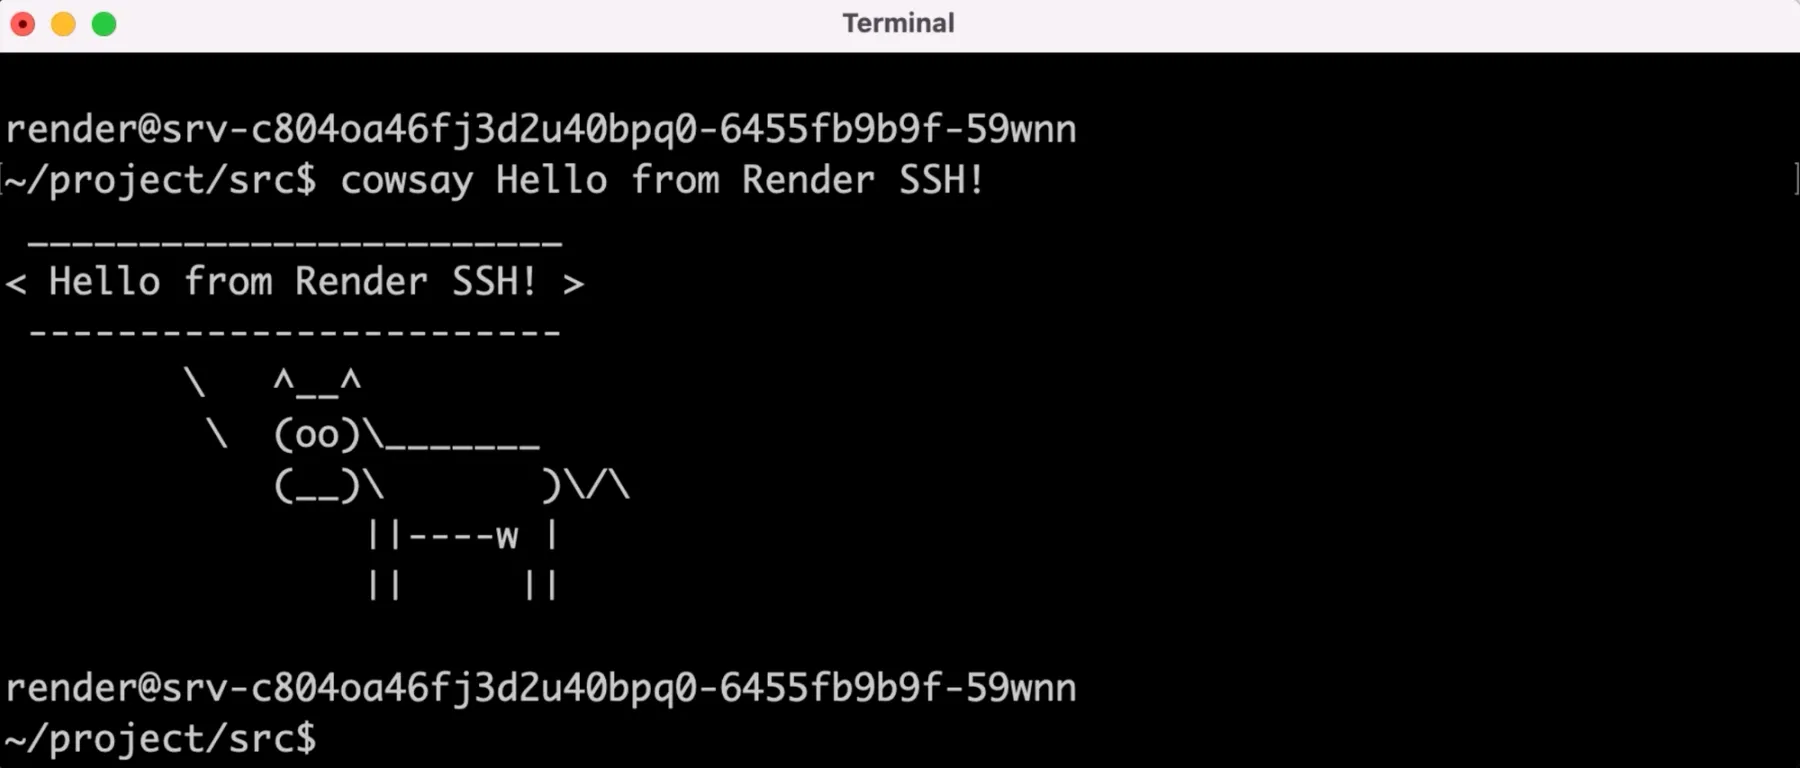
Now I can start the debugging session! In VS Code I’ve opened the project deployed to Render, switched the left side panel to Run and Debug, and then clicked the play button at the top to start debugging.
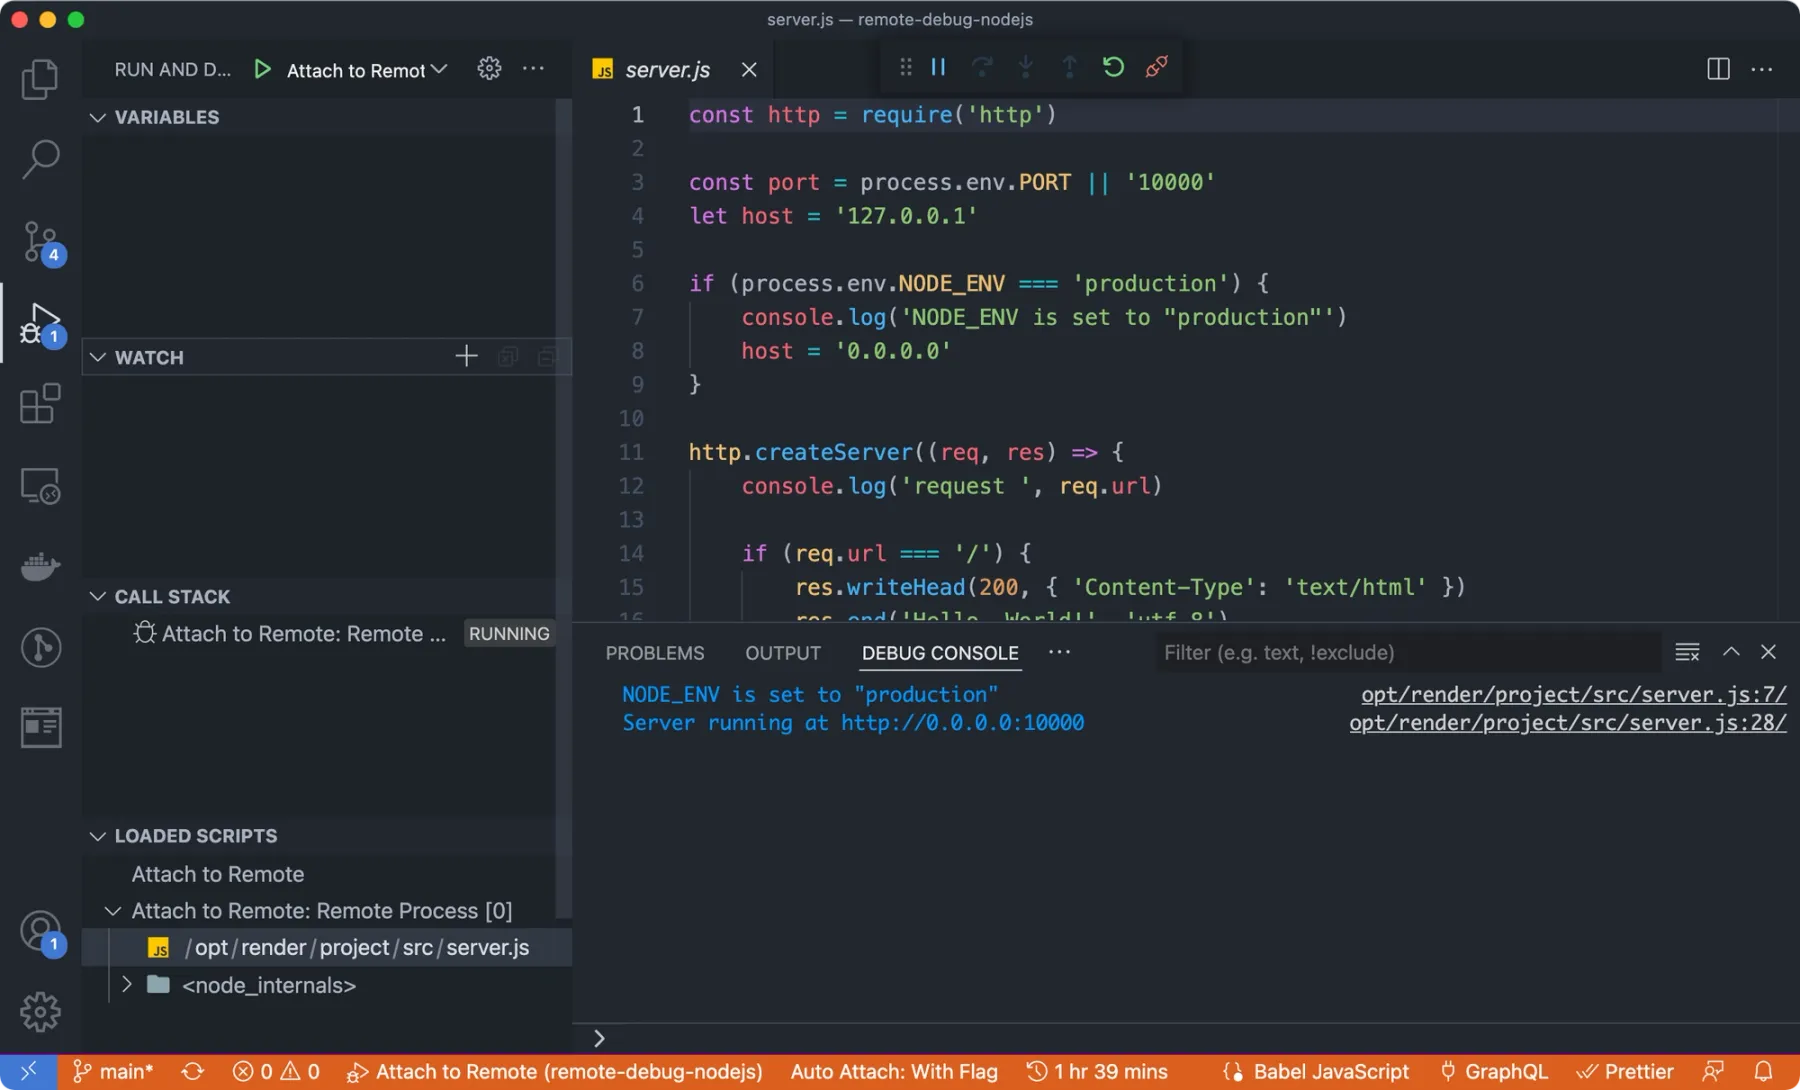
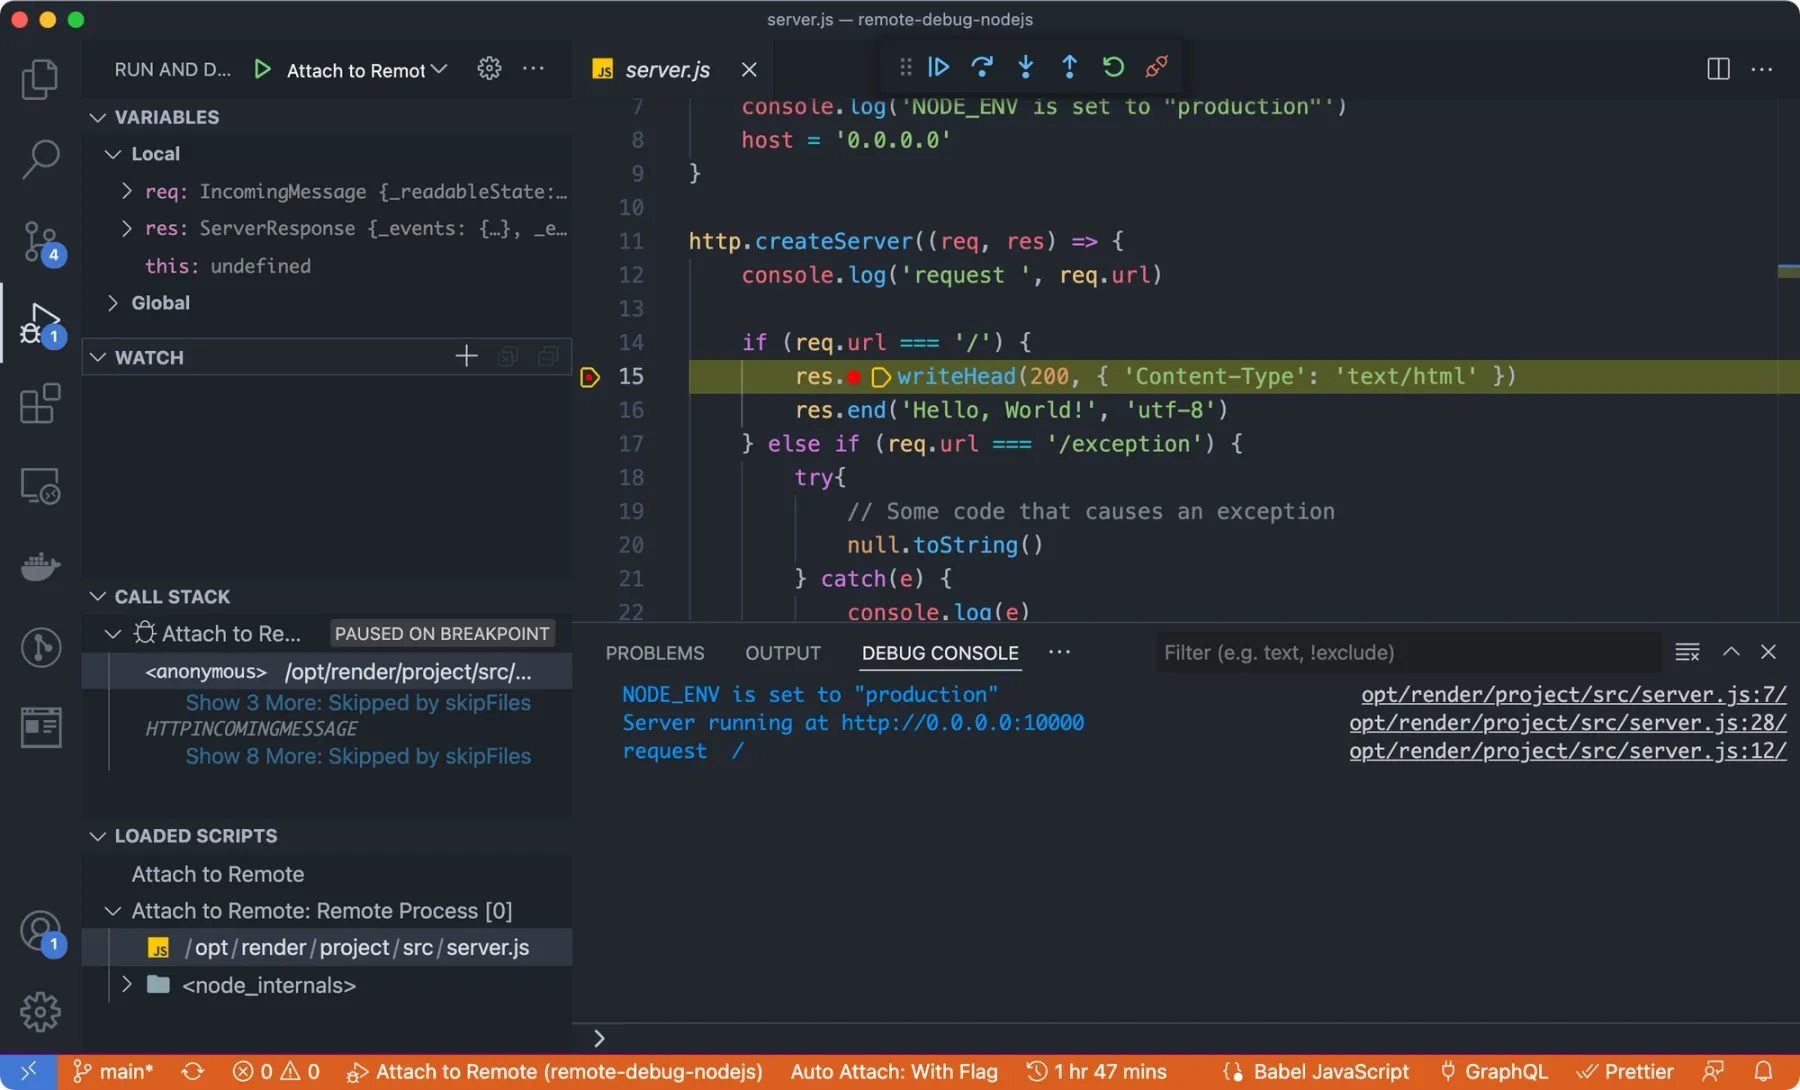
Let’s walk through everything I can see and do now. On the bottom, a Debug Console appeared, which now shows me the logs from my service (stdout and stderr). On the left within the Loaded Scripts panel, I select the server.js file so that I can add breakpoints and see which line program execution is on.
To confirm that remote debugging is working the same way local debugging does in VS Code, I add a breakpoint on line 15.
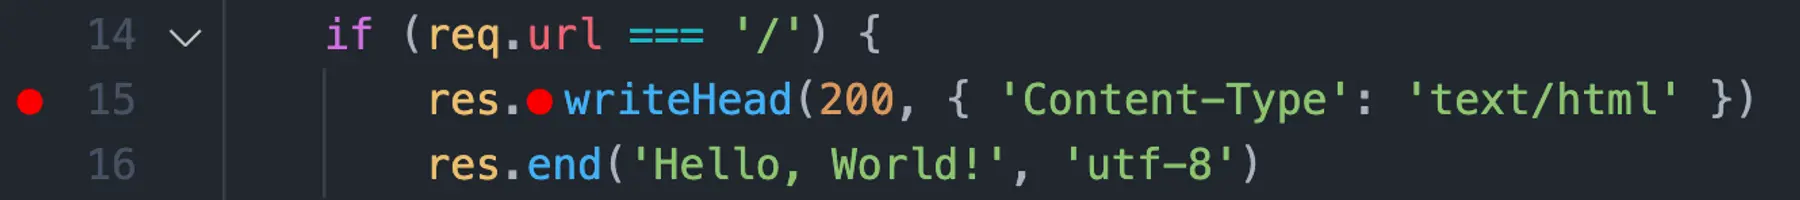
This is part of the code that is executed when a request to / is made. I make a request to that path in a new browser tab, and it looks like everything is working as expected! I can see that execution paused on line 15, and VS Code shows me the state of the req and res local variables and the call stack.
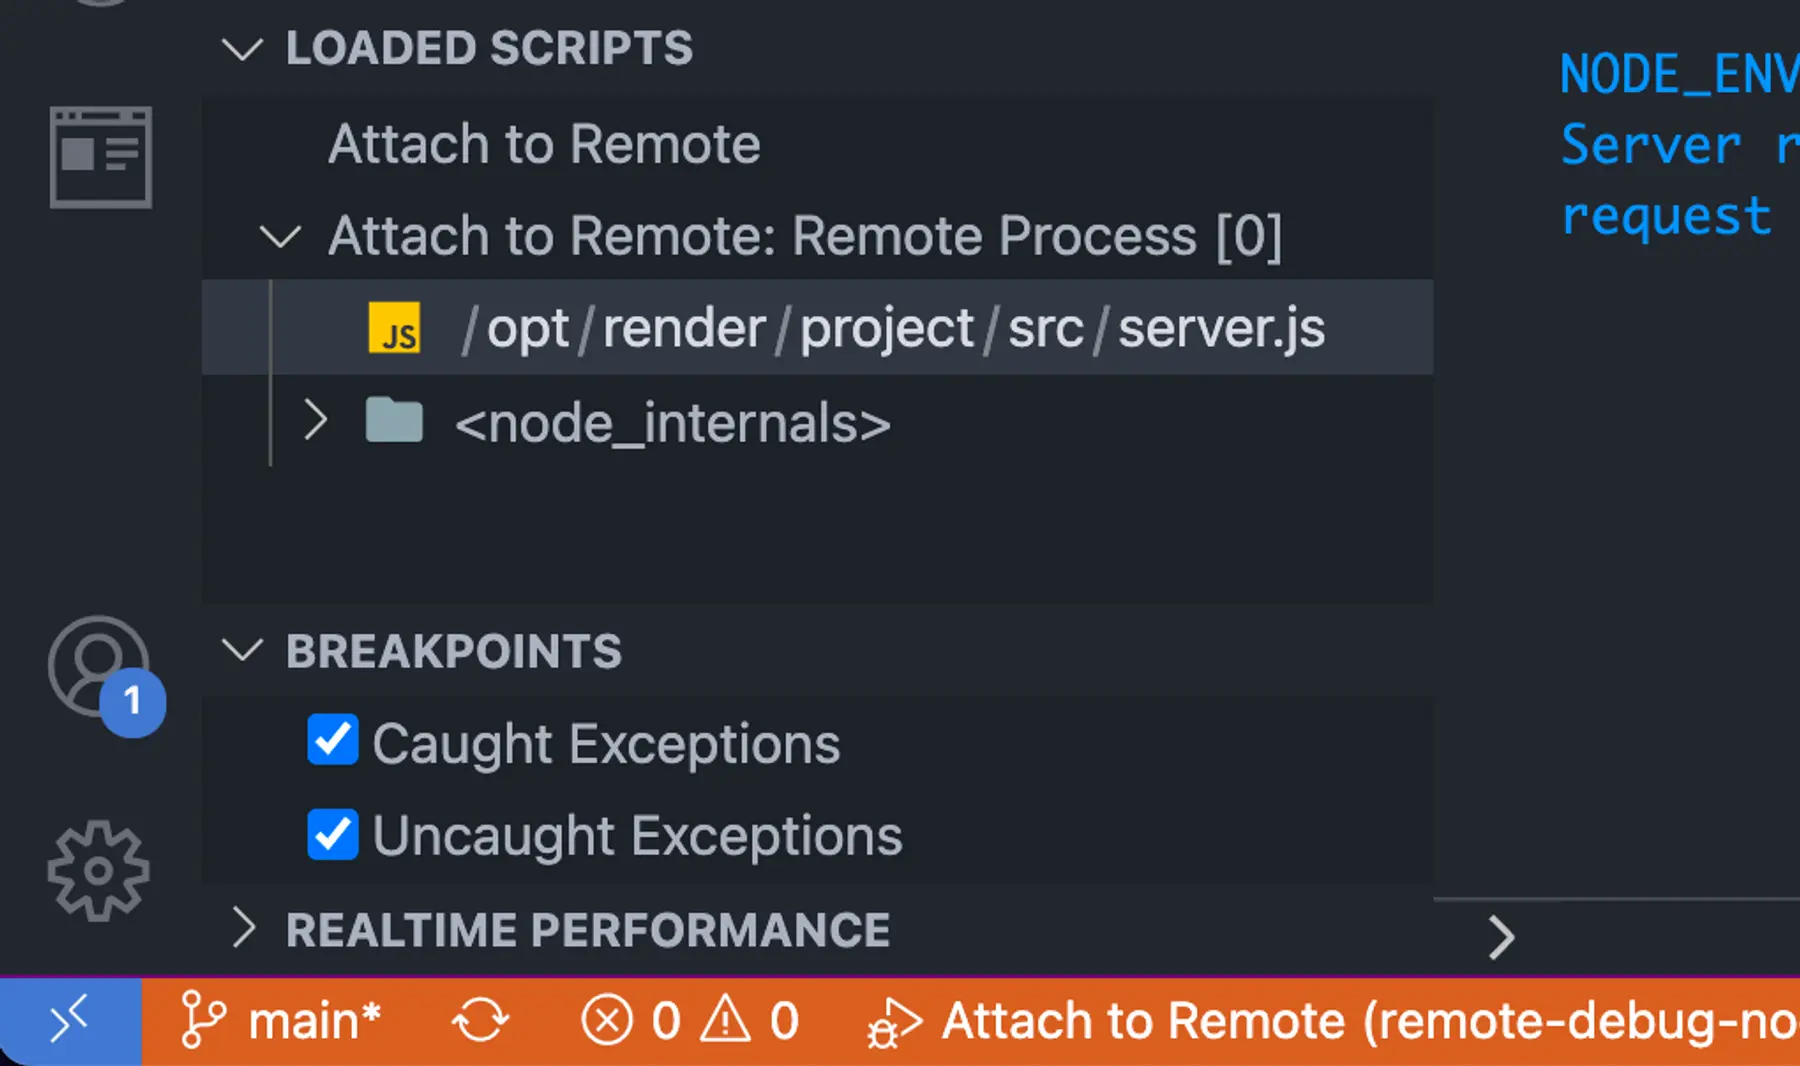
Earlier in this post, I said that remote debugging is helpful to investigate an issue observed in production but not on my local development machine. Let’s say the bug causes an exception, but I don’t know which line of code is generating the exception. I can tell VS Code to automatically pause program execution when it hits both caught and uncaught exceptions.
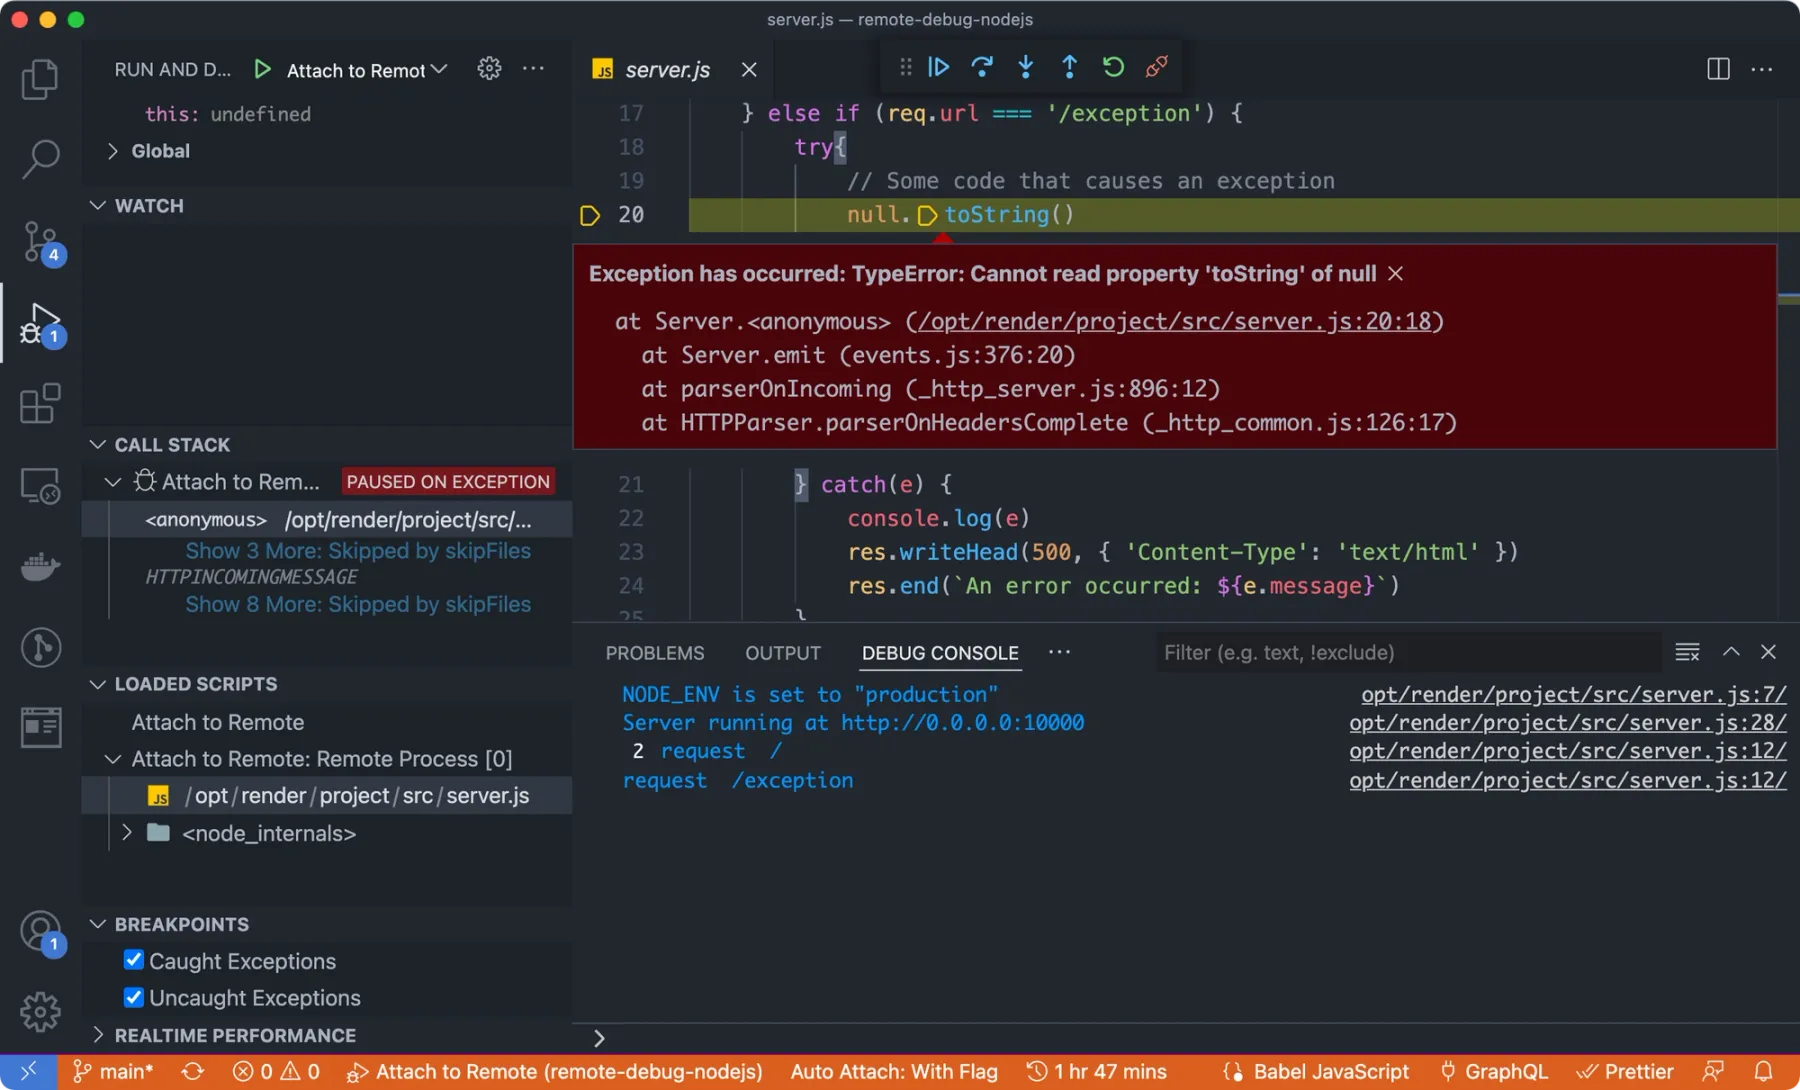
To test this out, I make a request to /exception. VS Code automatically pauses execution on the line that generates the exception. This example is contrived because I purposely wrote this line to generate an exception. Still, it’s a simple demonstration of how you can remotely debug exceptions before you have to handle a real-life (and more complex) scenario.
More to Explore
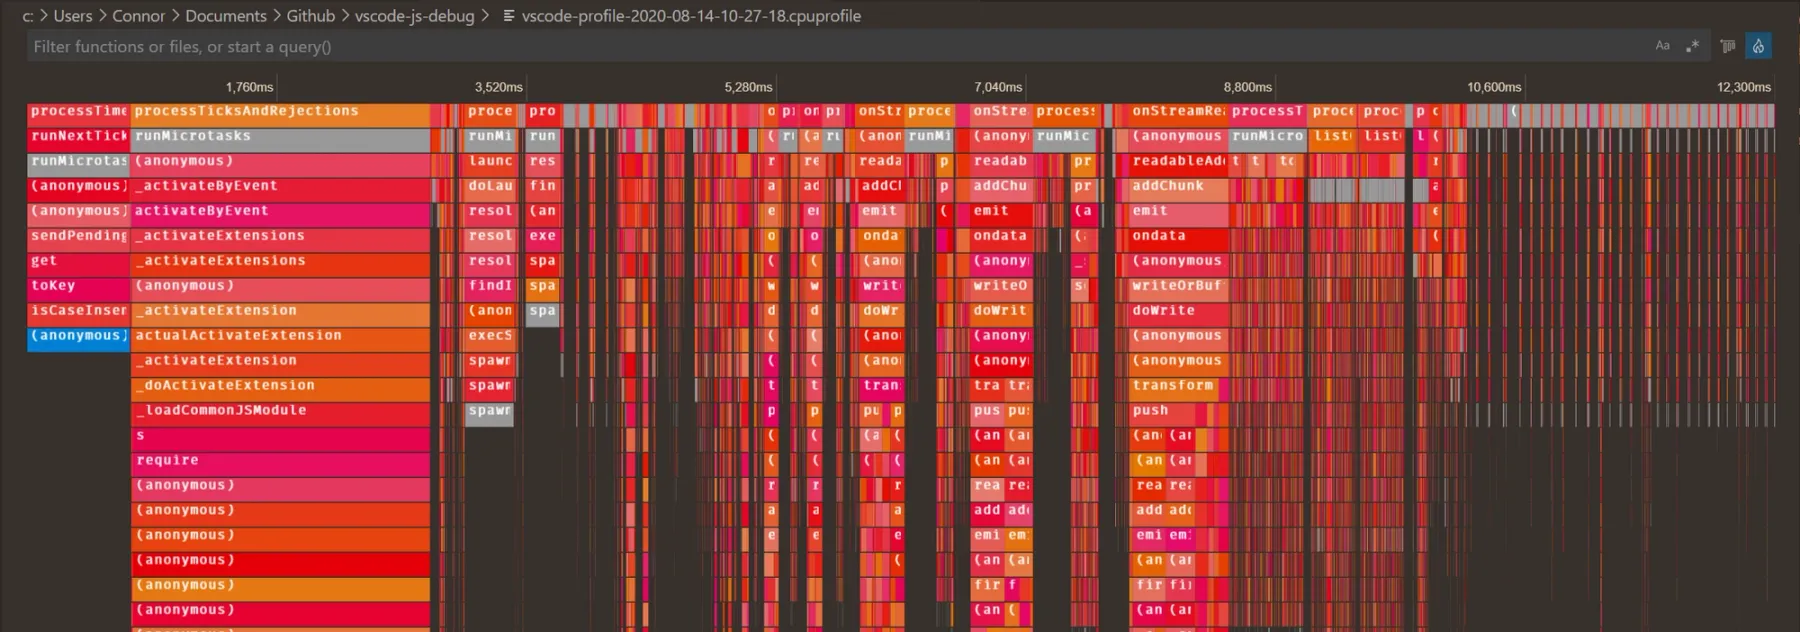
VS Code’s remote debugging feature can also help if you need to investigate CPU or memory use. The Flame Chart Visualizer for JavaScript extension provides a real-time chart of CPU and memory use of the node process and a flame chart to help you identify CPU hotspots in your code.
And you can use VS Code to debug more than just Node.js remotely: use it to connect to an Elixir cluster, a Go process, a Ruby process, and much more. There are VS Code extensions available for all popular languages that enable remote debugging for that language.
What are you going to use Render SSH for? Let me know!
Footnotes
-
The shell that’s run is configured per user on the remote machine. You can also override the command by appending a command to the end of the
sshcommand. ↩