This week we shipped two new logging capabilities for quickly diagnosing and debugging service issues:
- A new Log Explorer with text search, label-based filters, and jump-to-context
- Automatic HTTP request logs for all web services belonging to team accounts
When your app misbehaves, it's vital to assemble a complete picture of the problem as fast as possible, and these features help you do exactly that. Let's dive in!
Revamped log explorer
The new log explorer is available from your service's Logs page in the Render Dashboard:
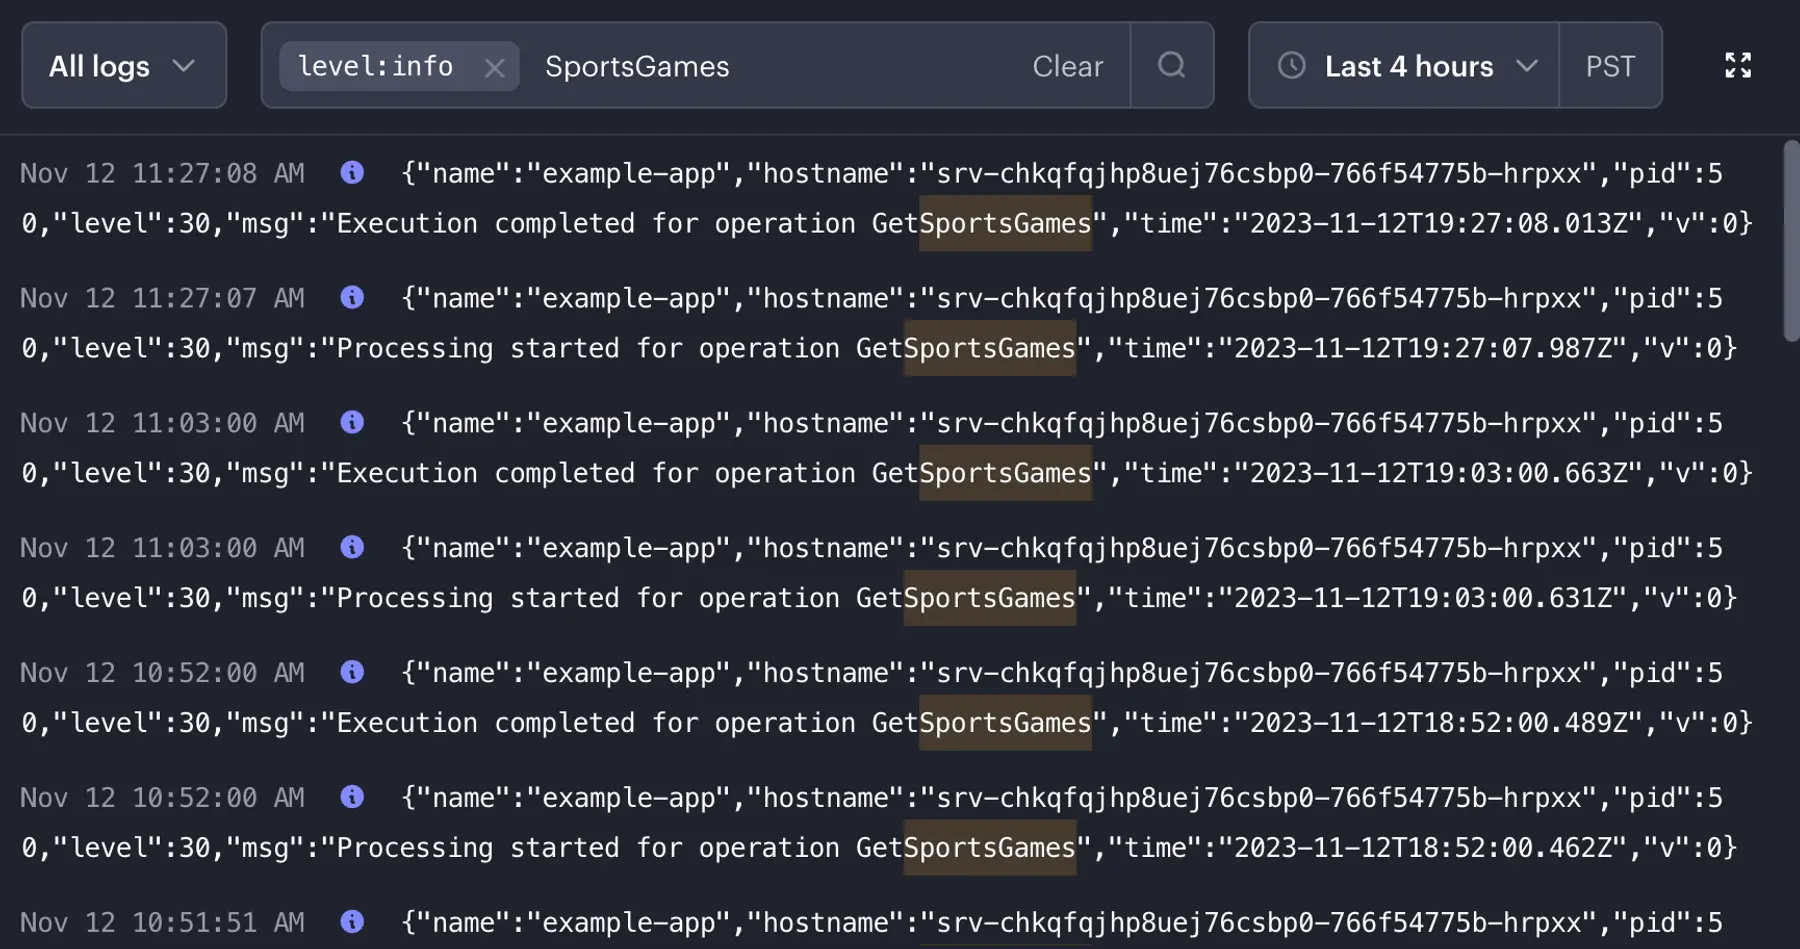
Search your logs for an arbitrary string (like a function name or user ID), filter by supported labels (like level), and limit results to any time range within your account's retention period.
When you identify a line of interest, mouse over it and click its View in context button to open a new tab that shows the line in its original position. This gives you a clear, chronological picture of what was going on right when an error occurred.
Head over to your dashboard and give the new Log Explorer a try!
HTTP request logs
We now automatically generate HTTP request logs for web services belonging to team accounts. These logs appear alongside your application logs in the Log Explorer—see the lines starting with [GET] below:
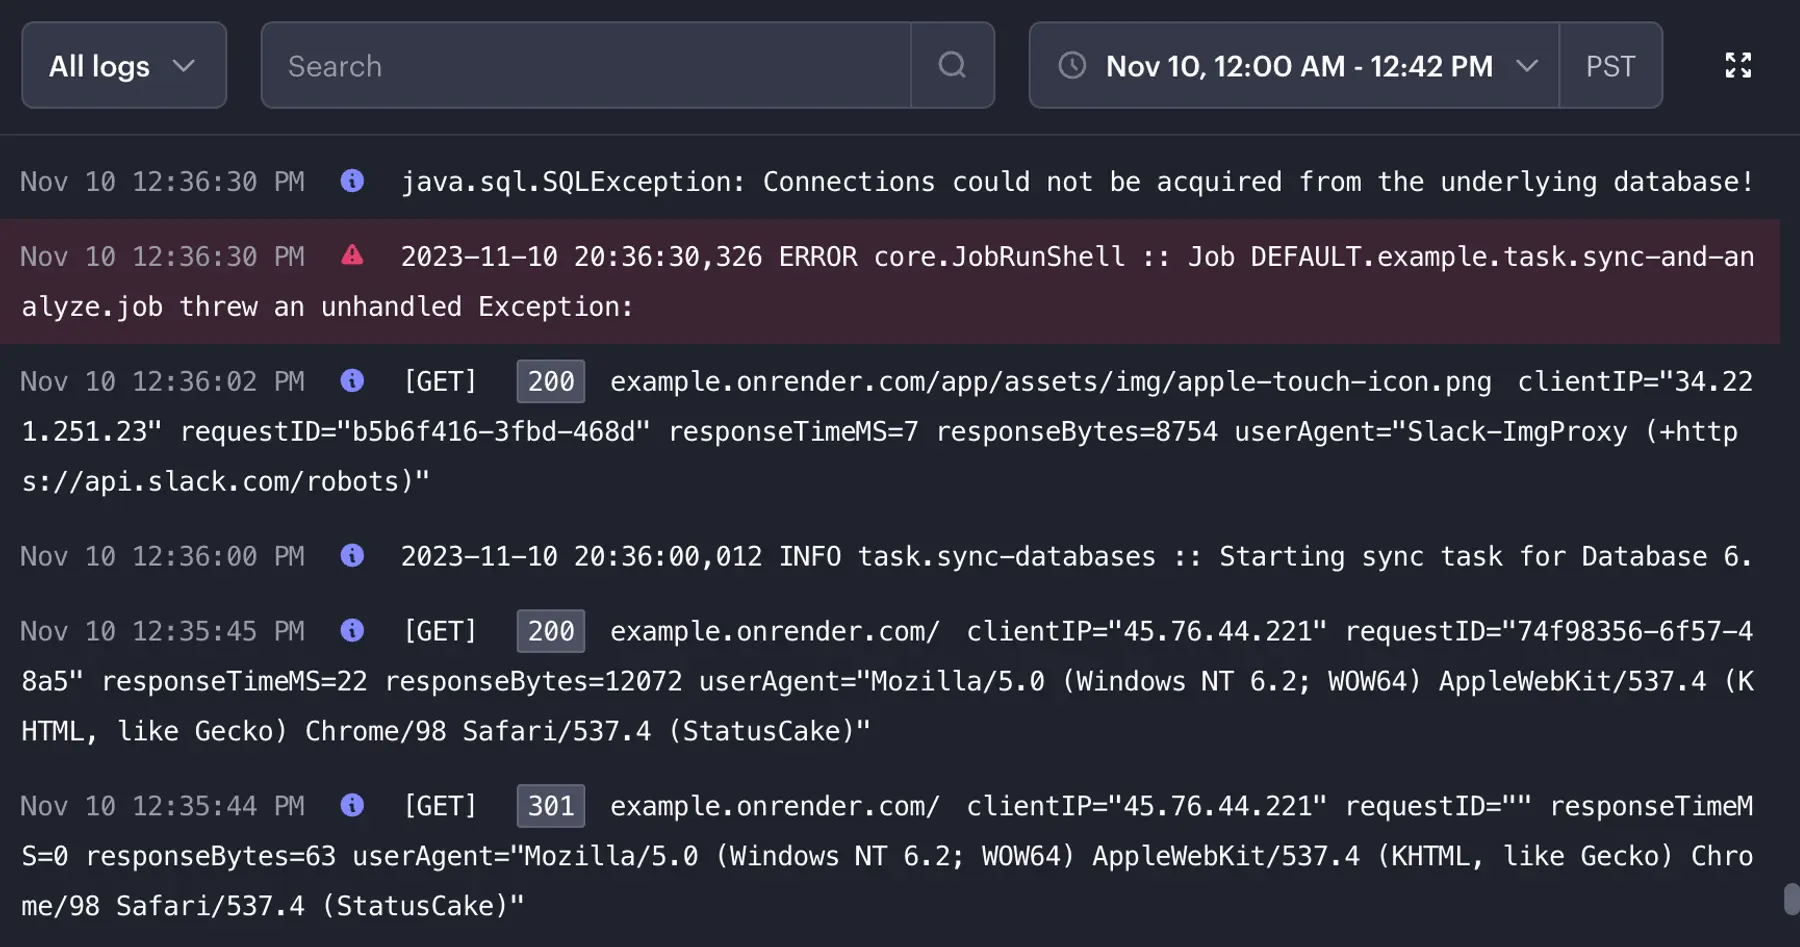
You'll notice that HTTP request logs include a requestID value, such as 74f98356-6f57-48a5. This uniquely identifies a request sent to Render from the public internet. Render sends this same value to your service and in its response to the requesting client—in both cases via the Rndr-Id HTTP header:
If your service extracts this ID from the header and includes it in all logs related to a particular request, you can search for that ID in the log explorer to trace a request's full execution!
Log reporting example: Datadog
If your team has set up a log stream, Render now also forwards HTTP request logs to your third-party provider. This lets you set up advanced metrics reporting for your Render web traffic.
As an example, if you're streaming logs to Datadog, here are some quick steps for visualizing your HTTP request data:
-
In Datadog, select Logs > Generate Metrics:
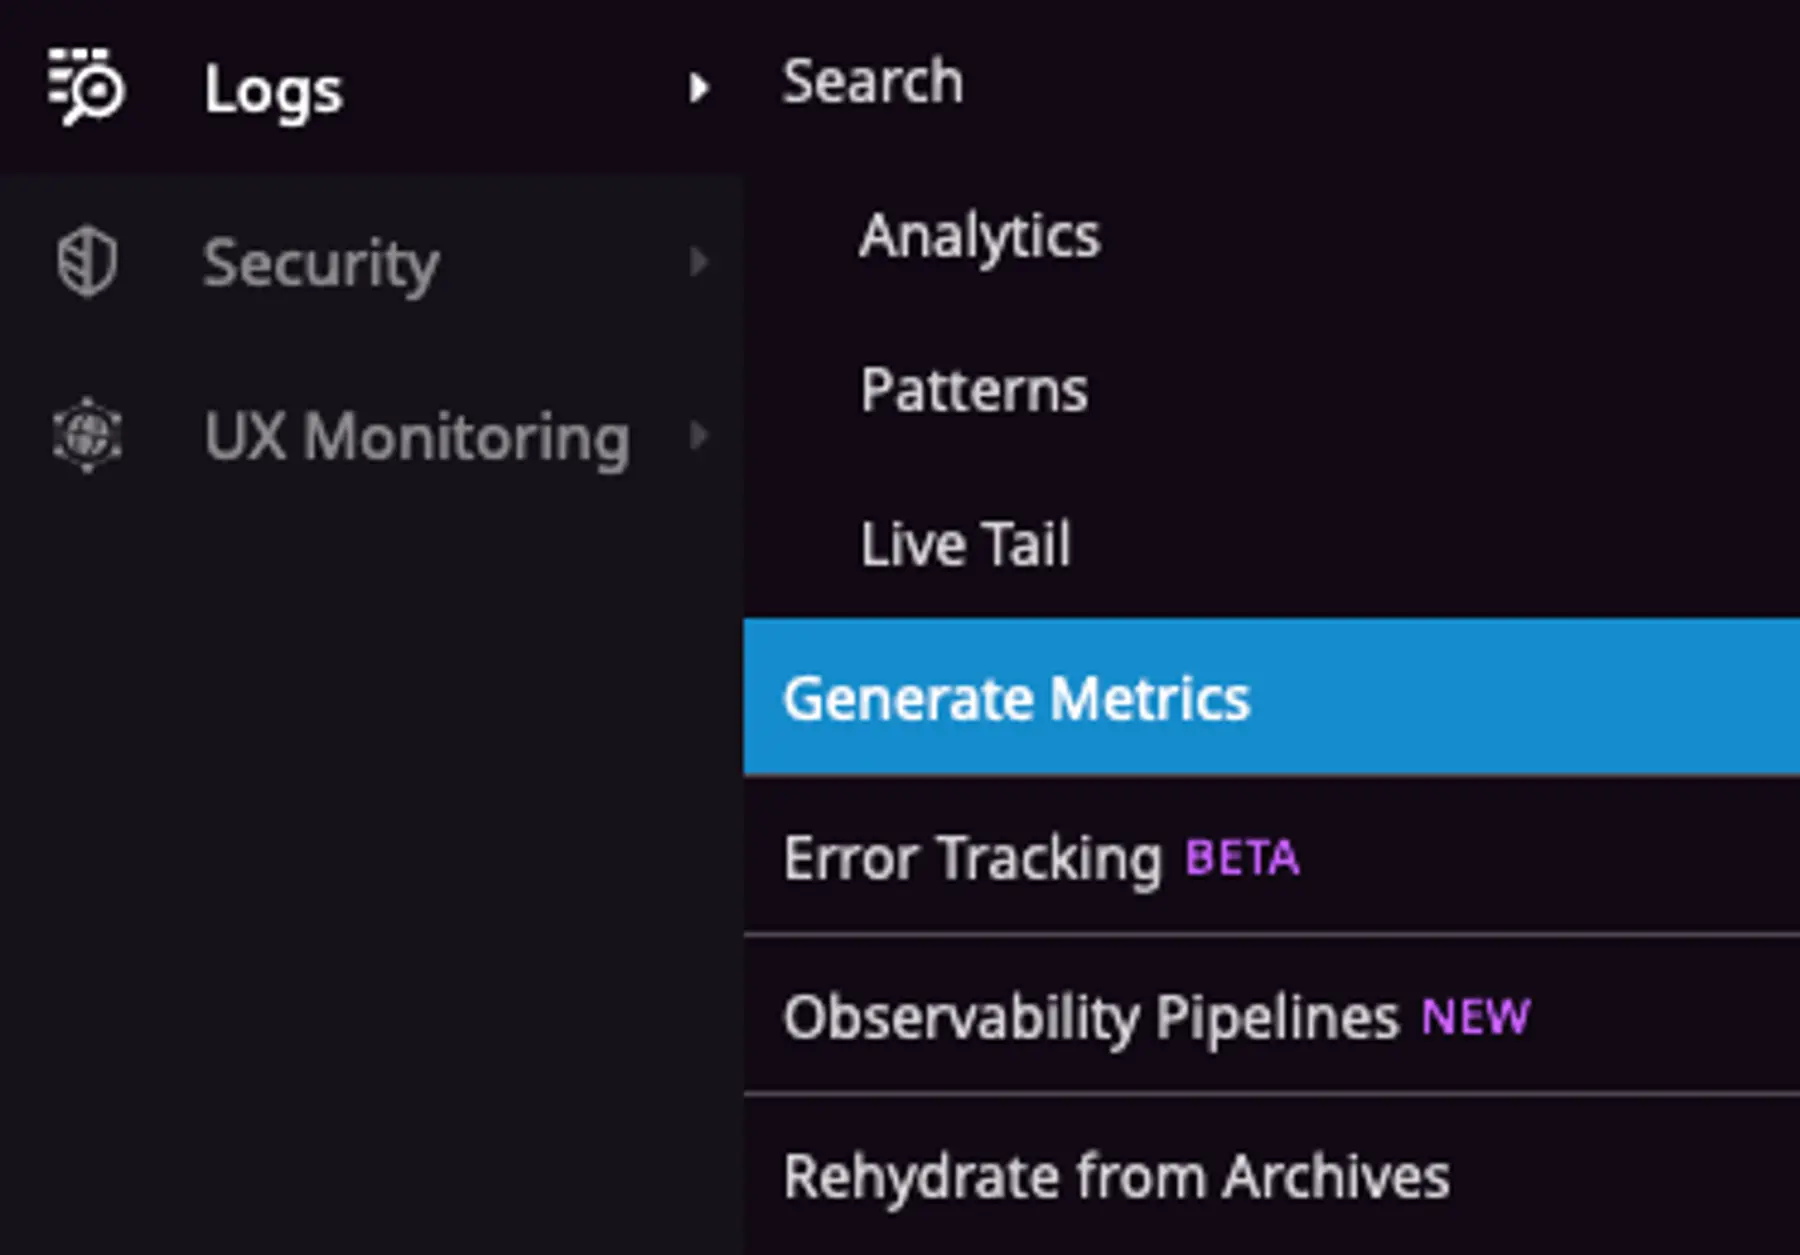
Selecting Generate Metrics in Datadog -
Click + New Metric.
-
Give the new metric a descriptive name (like
render_http_request_logs), then set the query to@syslog.msgid:http-requestlike so: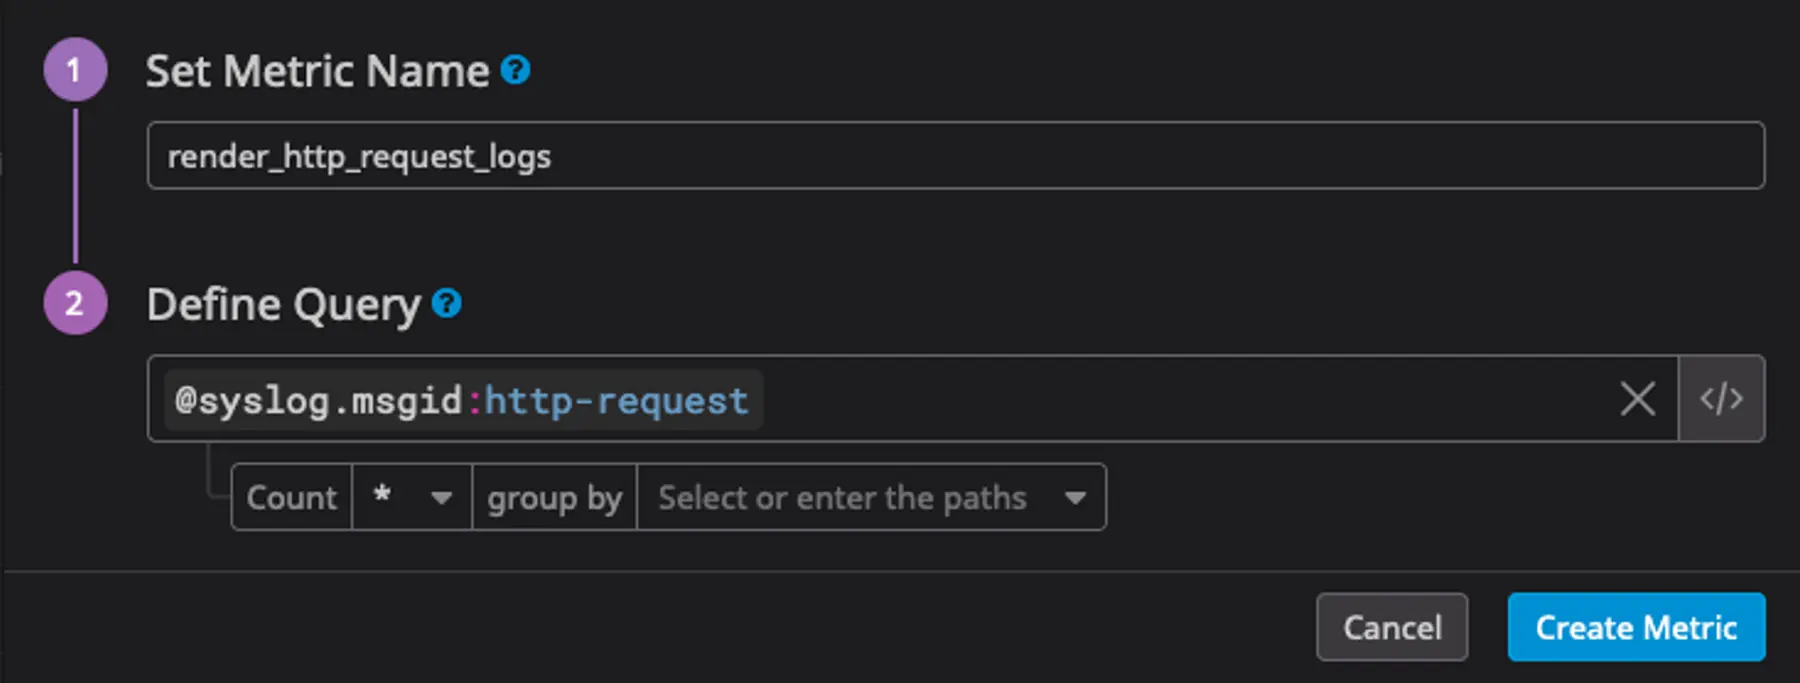
Selecting in Datadog -
Under group by, select one or more log fields to compare in your visualization. Depending on what you want to visualize, we recommend a combination of these:
@host(nothost—note the@)@statusCode@path@syslog.hostname(this value is the ID of your Render service)
-
Click Create metric.
-
From your metrics summary page, click the See in metric explorer button next to your new metric.
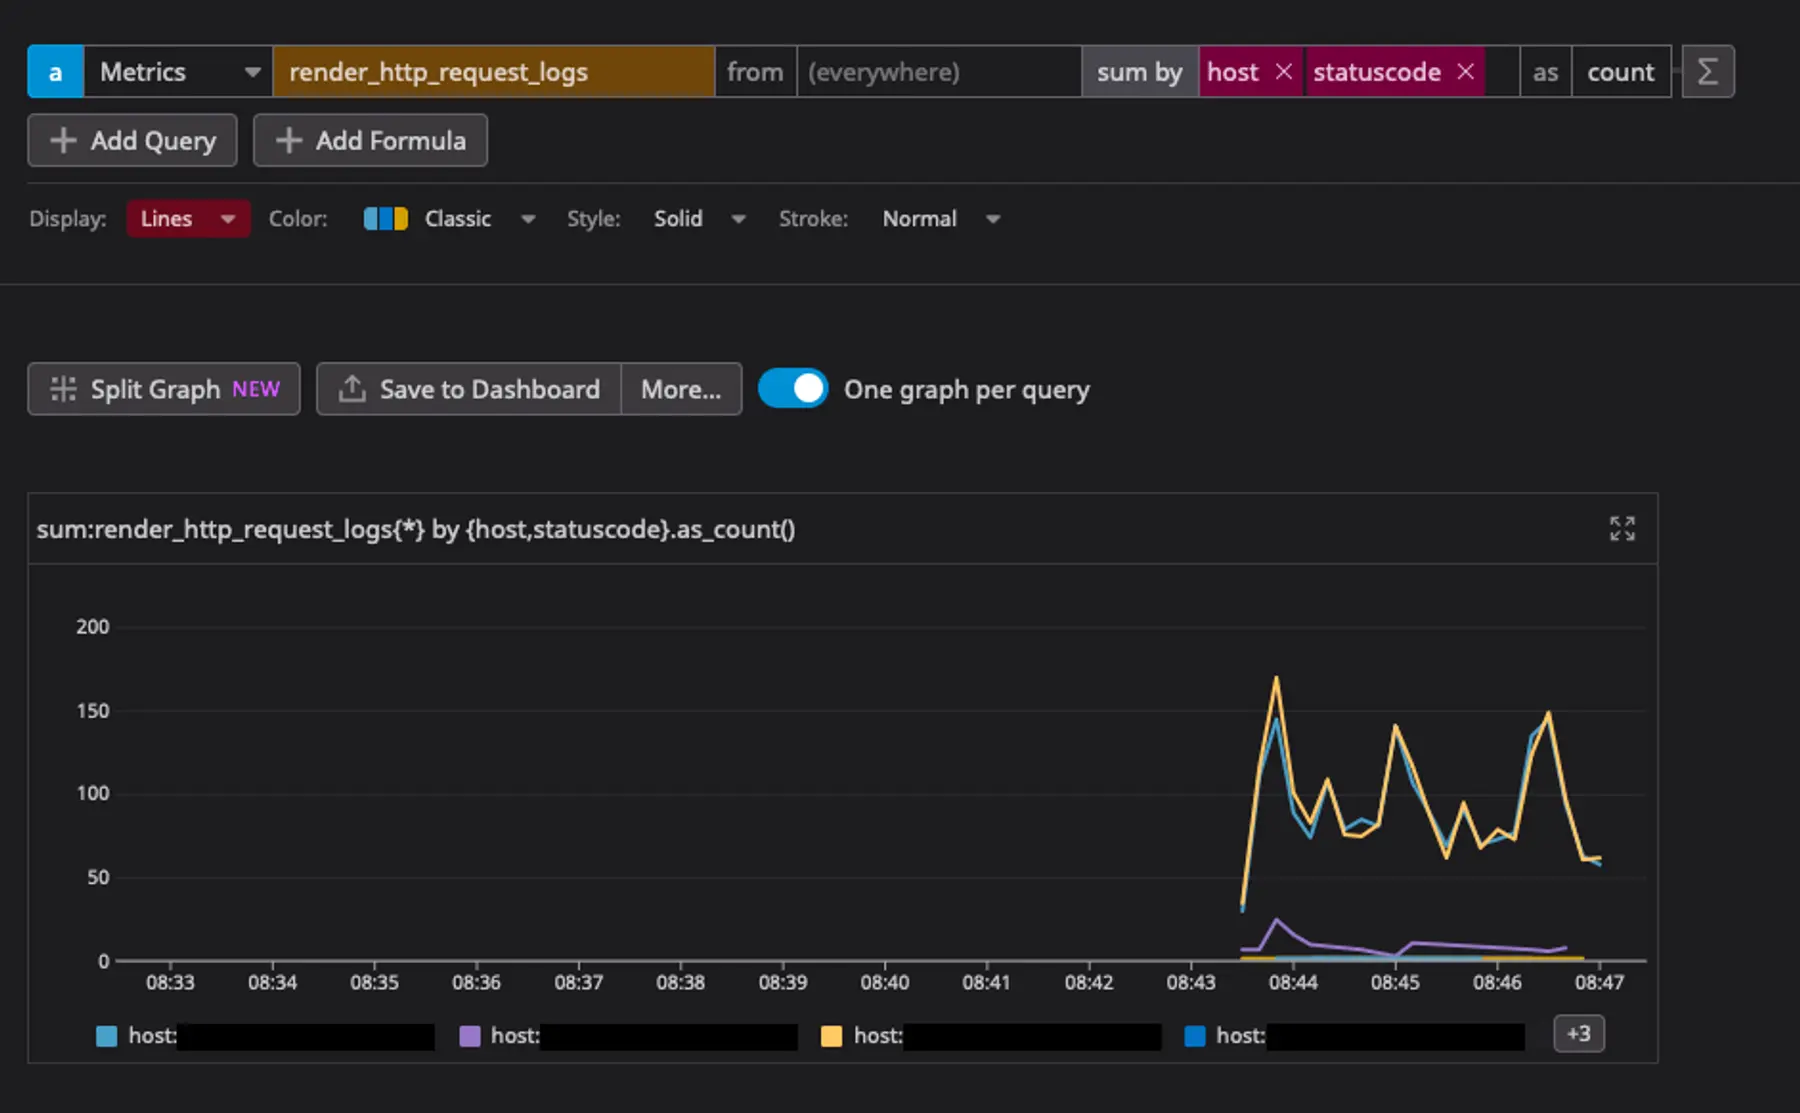
Now you can view HTTP request data broken down by status code, host, or any other characteristics you've selected!
The right tools for the (tough) job
Debugging an unexpected issue with your production code is rarely easy and often urgent. These logging improvements go a long way in accelerating your search for a root cause, so you can ship a fix in no time.
Expect more logging capabilities to come, including additional Log Explorer features! If you'd like to see us add something in particular, don't forget to submit a feature request. And for all the details on logging with Render, check out the docs.