Ops, circa 2008
Fifteen years ago, engineers wrote code and handed it to an operations team. Ops provisioned servers by hand (scripts if you were lucky!), deployed on a schedule, and carried the pager. Nobody tested infrastructure, because infrastructure wasn't code. Everyone expected 100% uptime, and nobody could deliver it.
DevOps and SRE fixed that by treating release and operations as software problems. Infrastructure became code in a repository, deployments ran through CI, and monitoring became a first-class engineering concern. SRE replaced the impossible 100% with an error budget you can publish and spend. Most importantly, the team that wrote the software gained the tools to release and operate it.
The modern data stack follows the old ops model
Data hasn't yet made this switch.
The modern data stack is built on Extract Load Transform (ELT): copy every raw table, byte for byte, into a central lake, then have a data team reverse-engineer it into metrics. Product teams throw tables over the wall. The data team learns every domain in the company using a cron, often without tests, against a 100% accuracy expectation that no software system has ever met. When an analytics table is wrong, the fix is to store everything forever in a data lake to replay history.
Data teams say the problem is that requirements always change, and that's true. But it's also true of every product ever built, and software teams don’t avoid ambiguous requirements at all costs. Instead, they ship, measure, and improve. Data gets stuck because the feedback loop is too long to do that: a bad transform can go unnoticed for months, so teams keep every raw byte as insurance.
Part of the problem is architecture. A “data pipeline" means a cluster, a JVM, and an Airflow server running against a cloud warehouse. You can’t put one next to your app on the same platform, in the same repo, under the same on-call rotation. So the pipeline lives elsewhere, owned by another team, and every change is a ticket.
That constraint is gone. A real-time pipeline now fits in less memory than a Rails process. The pipeline in this blog addresses the data feedback loop. It lives in the repo, it's gated by CI, it reports its own health, and it's held to 24x7 software standards. Once you can see a pipeline break, you stop hoarding every byte just in case it does.
Data as a software problem
Applied to data, the DevOps move has four parts, and each one shortens feedback loops.
Pipelines as code. The pipeline is a config file in the producing team's repository. It's reviewed in a pull request, versioned with the application that emits the data, and deployed by the same button. Nobody files a ticket to change it.
The logic is SQL, and it's decoupled from the environment. The future data stack has standalone logic, written in SQL, with an input source and an output sink. The same SQL runs against a JSON fixture on a laptop, a Kafka topic in CI, and a WebSocket firehose in production. That decoupling is what makes testing possible. When your transform only runs in the warehouse, testing just means checking the results. When the logic is portable, you test it the way you test any function: fixed input, expected output, milliseconds per case.
CI gates every deploy. Inputs and outputs are generic, so a test mocks the source with a file and asserts on the sink. A docker compose file stands up Kafka and Postgres for integration tests. A soak target runs the release image against a live stream and records its memory. The primitives are extensible, so teams can add custom validation checks using the same standard workflow. A verifiable transformation builds confidence and removes the need to store raw history.
The pipeline is a 24x7 service with an SLO. It reports a standard set of metrics that mean the same thing for every pipeline: lag (how far processing is behind event time), freshness (how old the materialized output is), and completeness (how many expected windows were actually produced). Instead of waiting for someone to check a batch job in the morning, those metrics power your alerts and error budgets directly, just like any other production service.
The rest of this blog illustrates these concepts in action using a Bluesky firehose and analytics API hosted on Render.
The stack
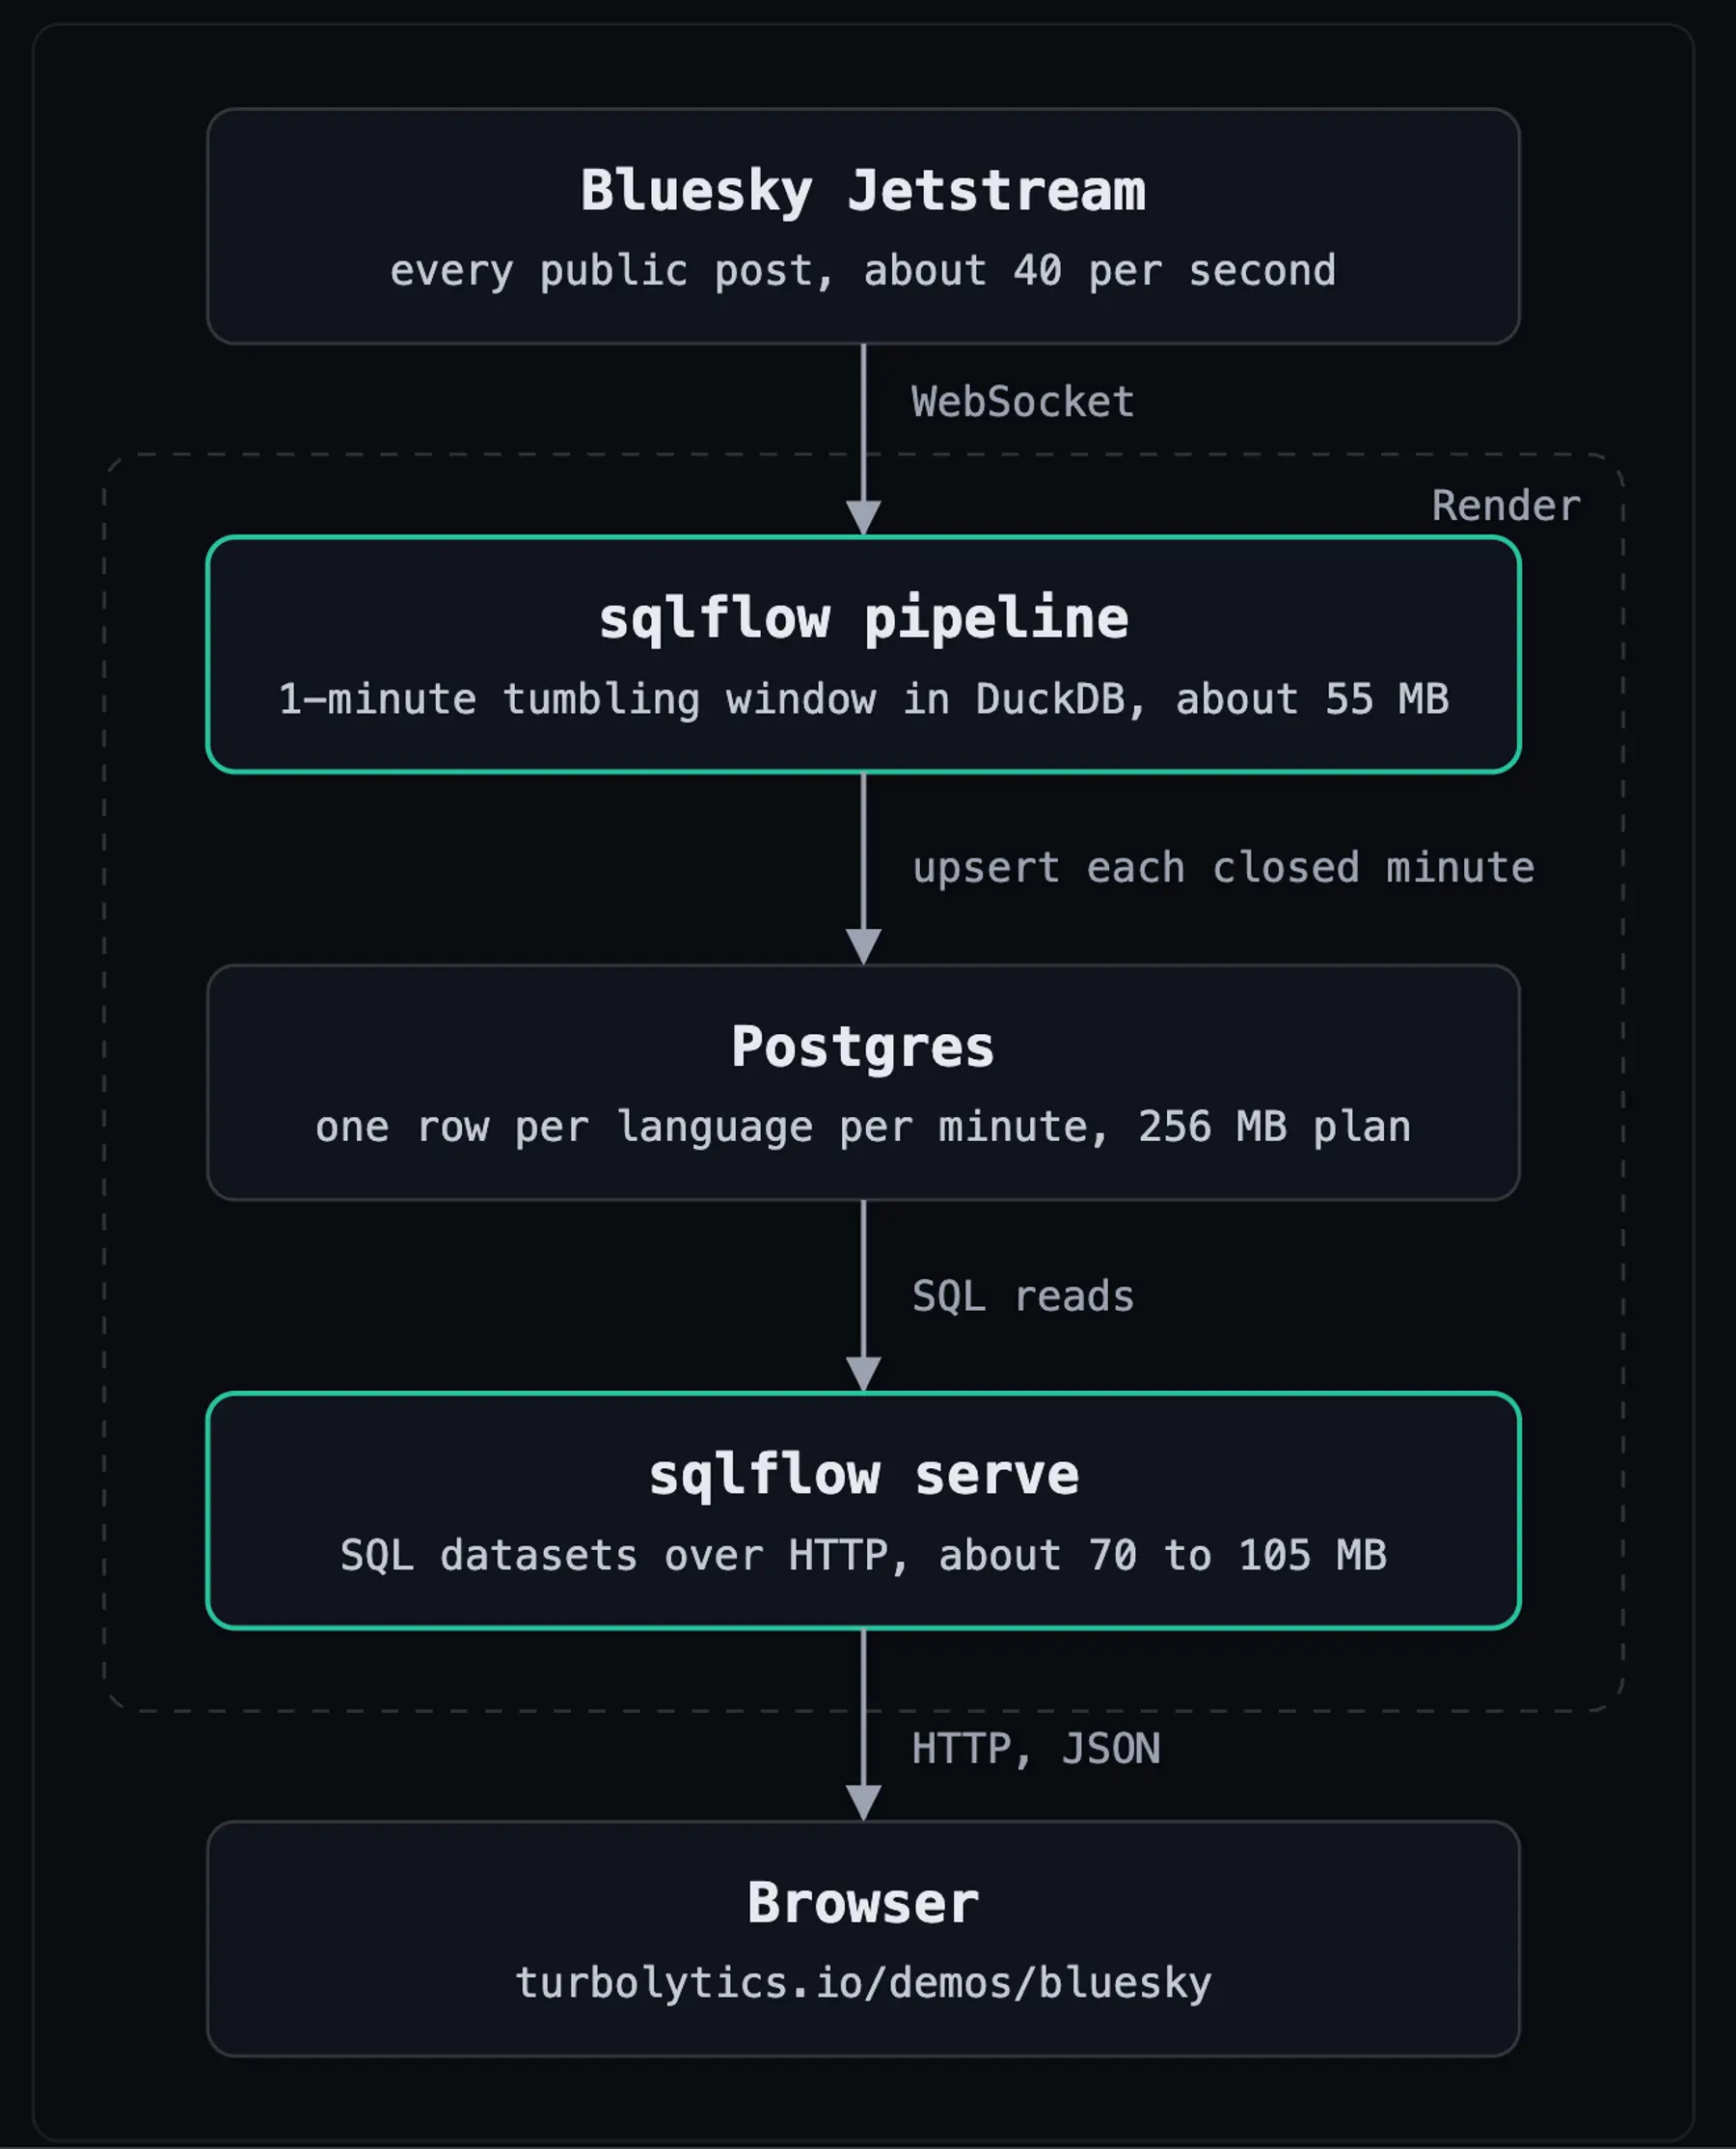
The pipeline counts every public Bluesky post by language in real time. It has three parts, all deployed from one Render Blueprint:
- A SQLFlow pipeline runs as a Render background worker. It reads Bluesky's Jetstream firehose over a WebSocket, groups posts into one-minute tumbling windows by language, and upserts each closed window into Postgres.
- Render Postgres stores one row per language per closed minute.
- SQLFlow serve runs as a Render web service. It exposes SQL queries as an HTTP API.
The pipeline definition is a versionable and testable YAML and SQL. There's no Kafka, no scheduler, orchestrator, or external data-quality vendor. The dashboard at turbolytics.io/demos/bluesky calls this API directly.
Each SQLFlow service runs on a Render instance with 0.5 CPU and a 512 MB limit. Postgres runs using less than 0.1 CPU on a 1CPU/512MB instance.
Infrastructure as code: Aggregate first, then store
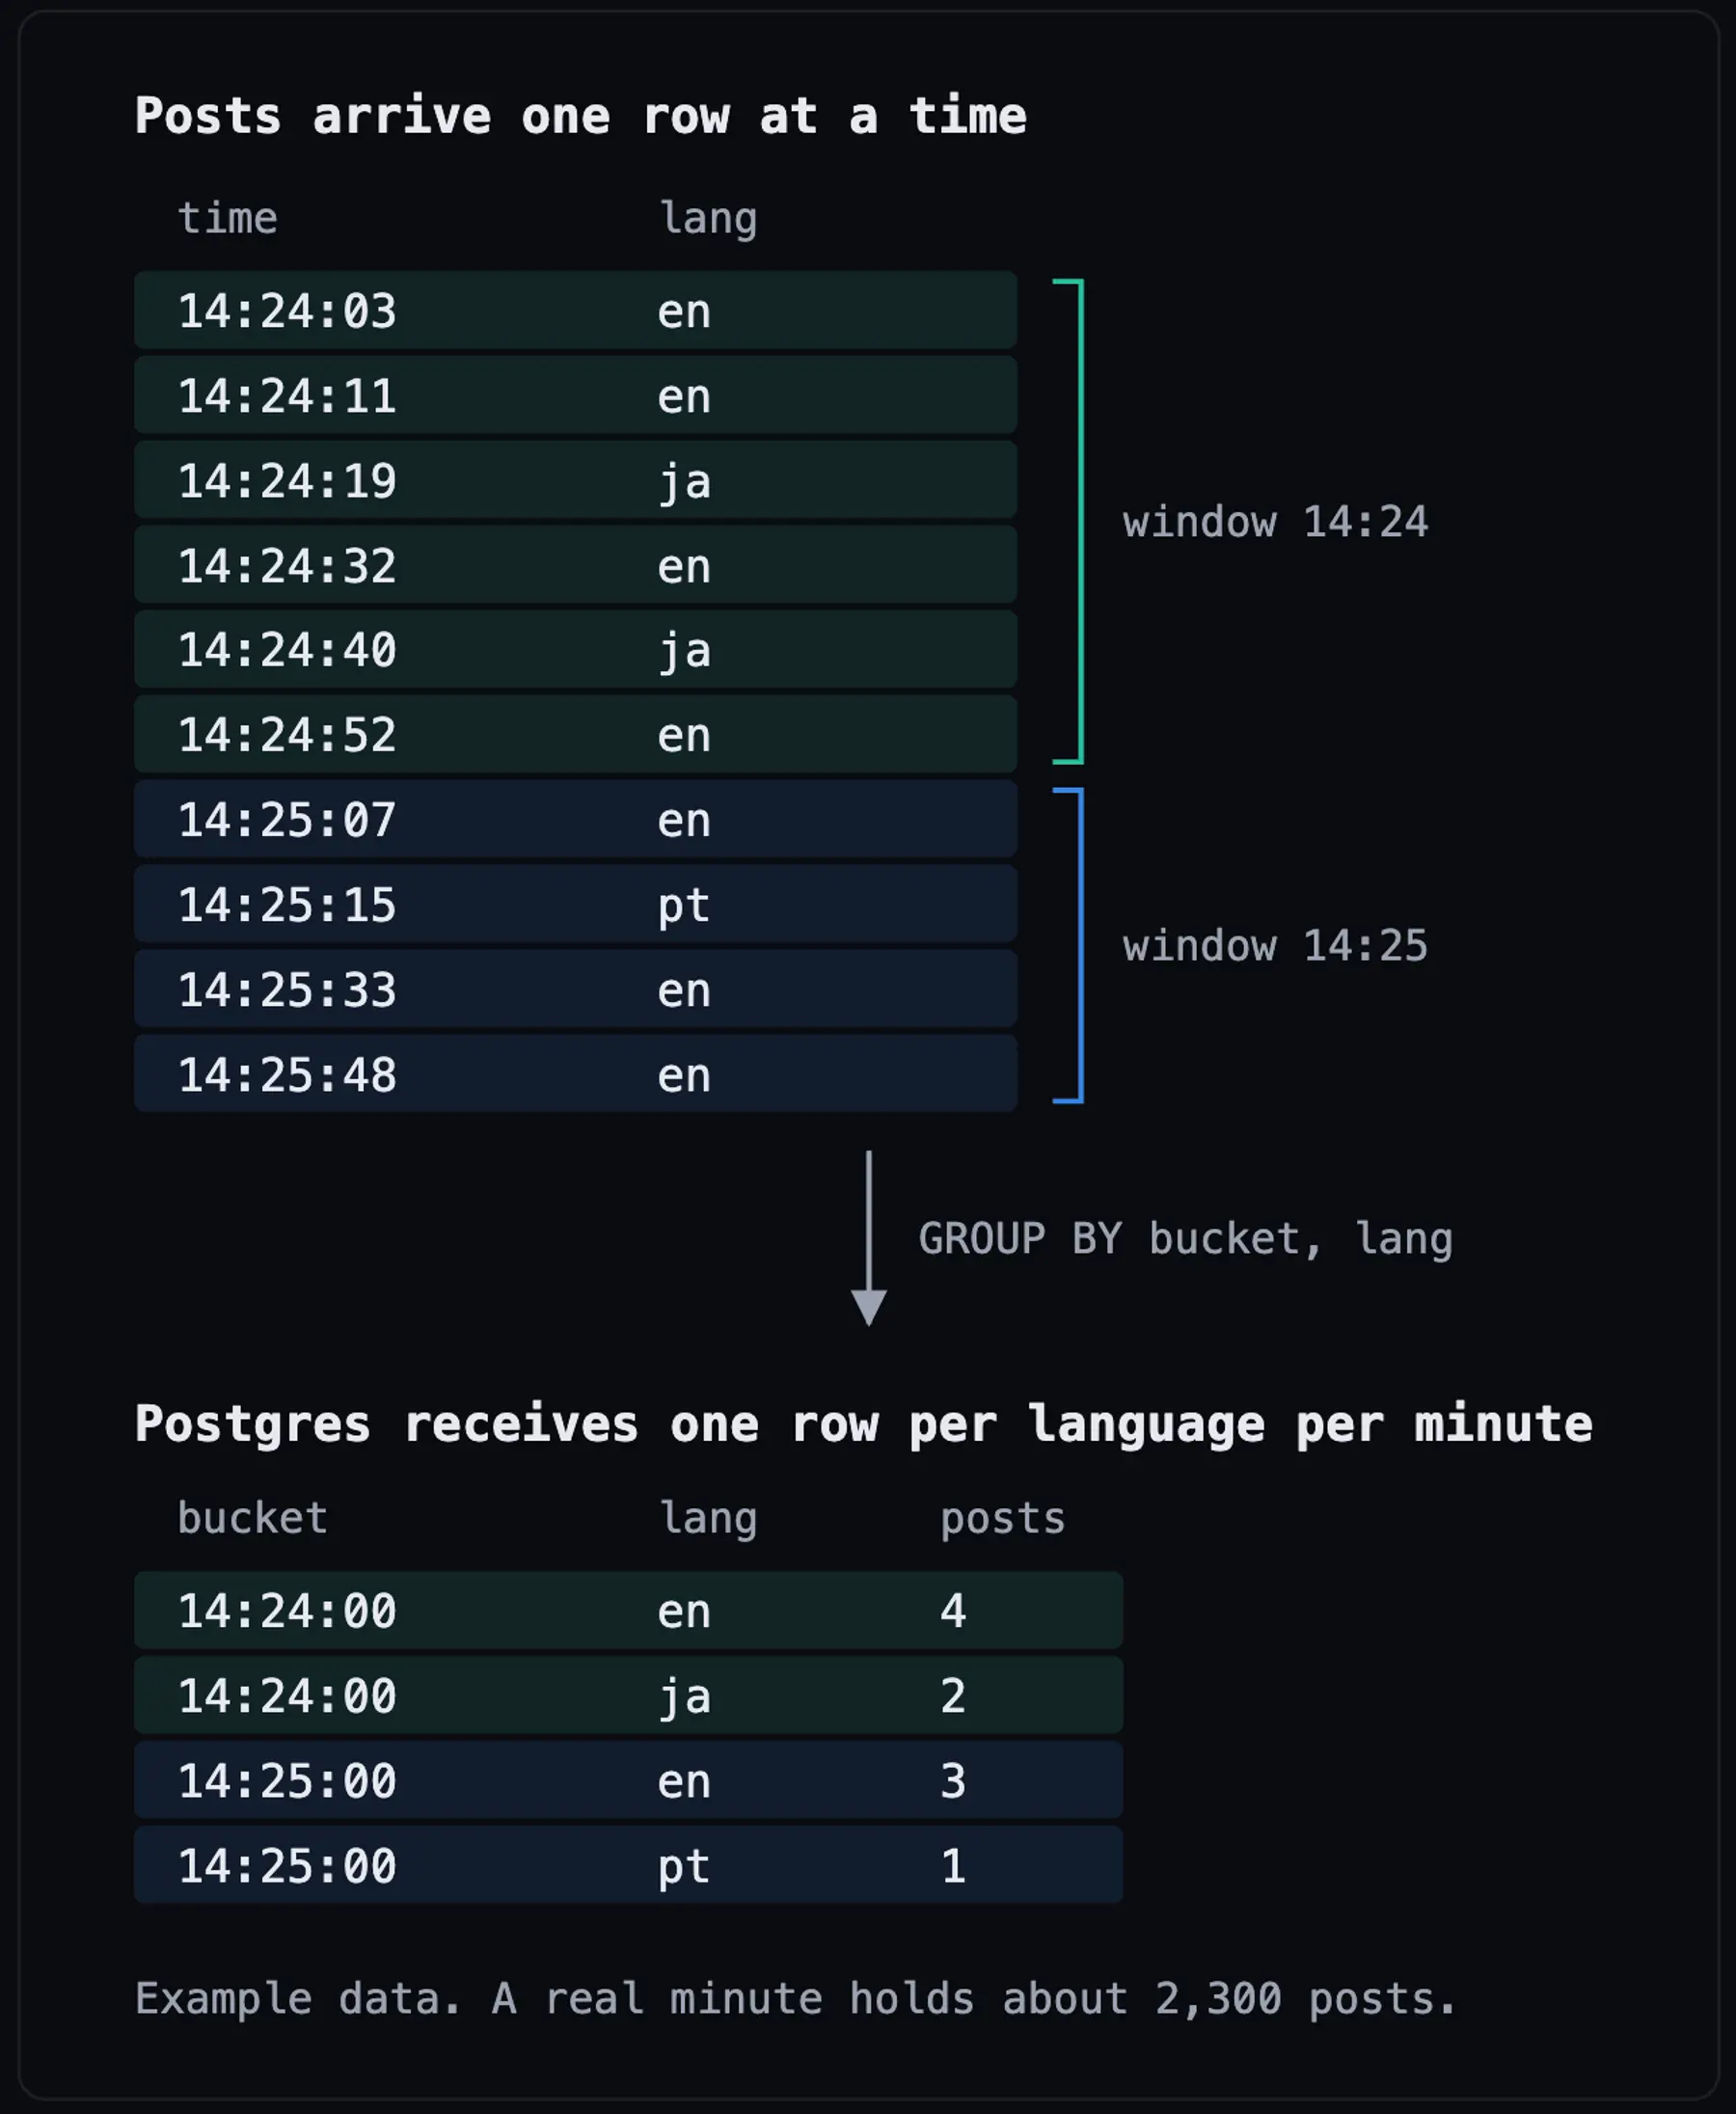
The design decision that makes this pipeline small enough to run efficiently as a service is simple: aggregate first, then store.
Standard ELT pipelines do the opposite by reducing last. They copy every raw record into central storage and then run heavy compute tasks to model those copies into a handful of metrics. While the resulting metrics are small, the compute and storage footprint required to produce them is massive.
By reducing first at the point of ingestion, this architecture drastically cuts down operational overhead. As roughly 40 posts arrive per second, the pipeline aggregates them in memory and writes only one summarized row per language per minute to Postgres. For example, between September 12 and 17, the pipeline processed 15 million raw posts down to just 6,577 one-minute window rows. The dashboard queries those 6,577 aggregated rows directly rather than scanning 15.1 million individual records.
Streaming systems have aggregated first for a decade. What's new is running this process without a cluster, in a config file that lives in Git next to the application that produces the data, with unit tests and observability available. This world requires elastic, quickly provisionable, right-sized instances rather than large, long-lived instances running the JVM.
We already trust software engineers to handle customer data in production. They have the tools and the background to build verifiable services. There's no reason the aggregation step should be the one thing that leaves their hands.
Observability: Leak hunting with fast feedback loops
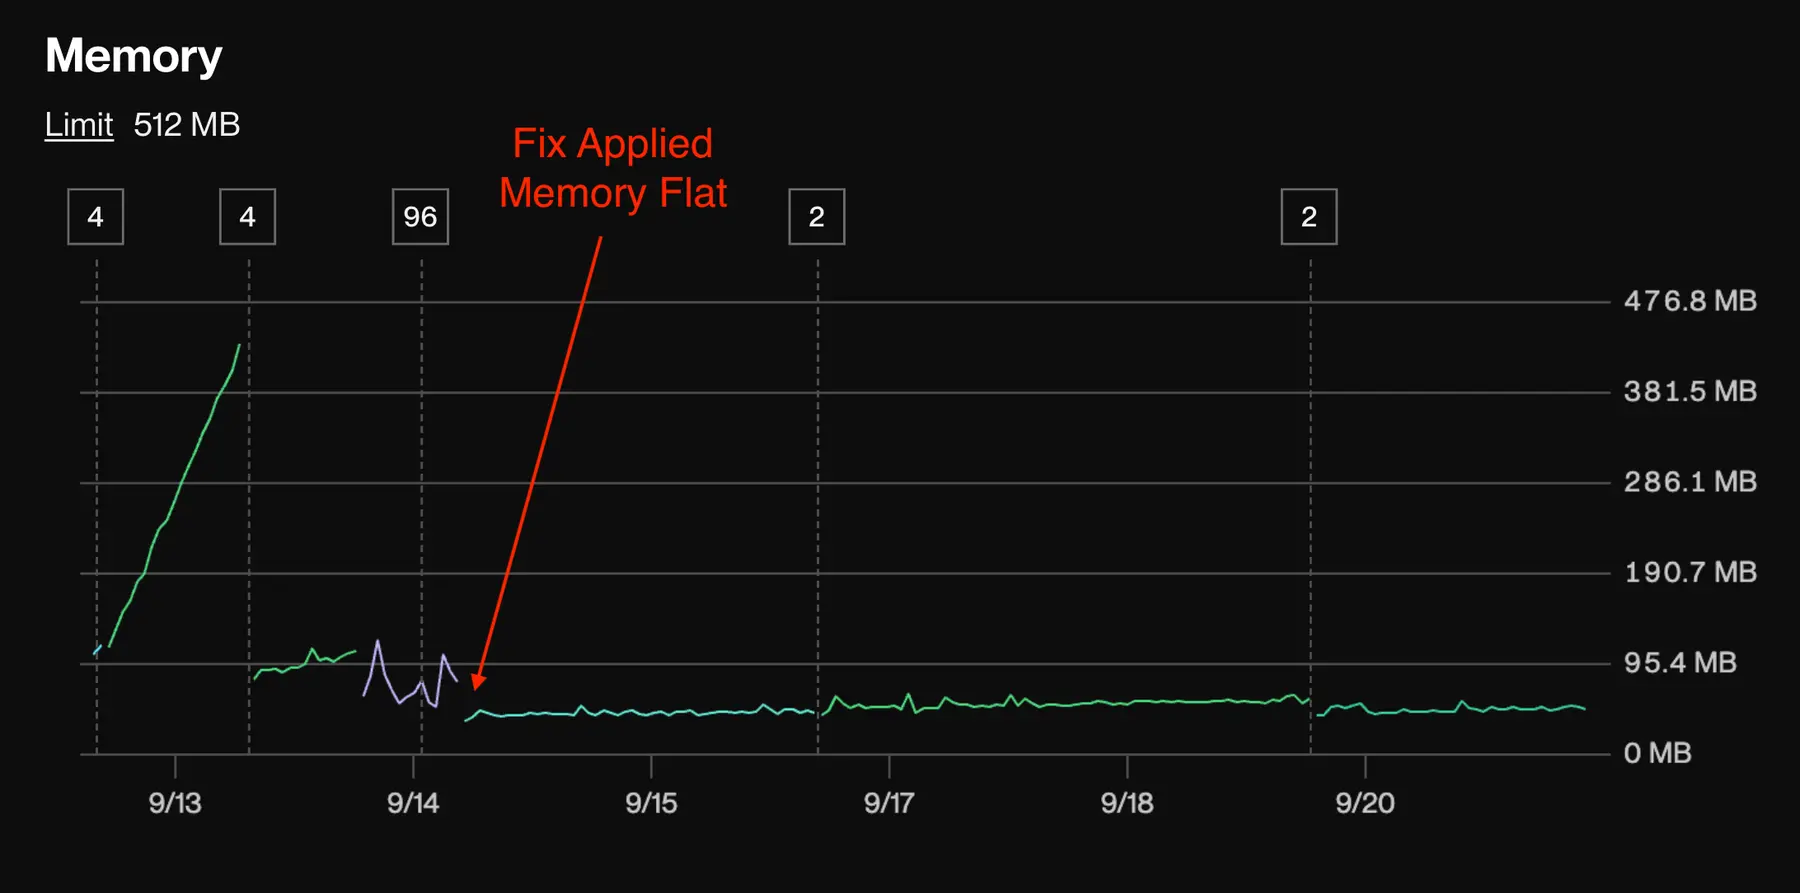
The first version of the pipeline went live on a Friday evening. The unit suite was green, and local streaming tests ran flat for an hour. By Saturday morning, the Render memory chart looked like this:
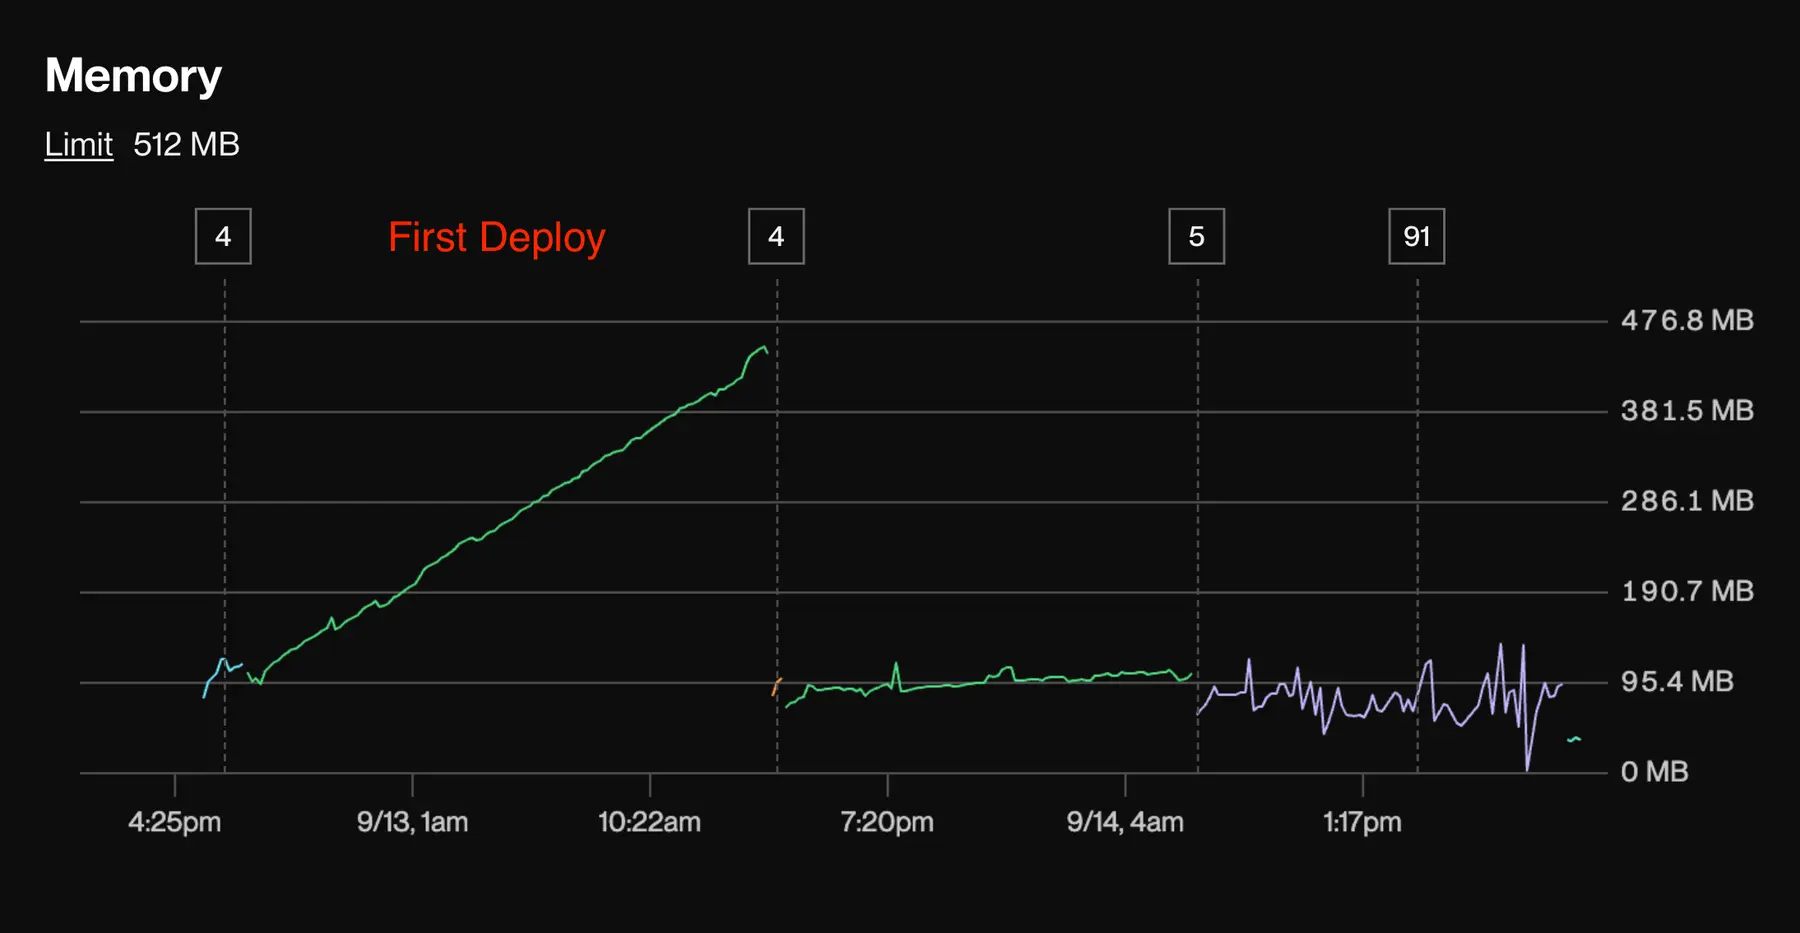
The worker had grown from about 100 MB to about 450 MB against a 512 MB limit, in a straight line, in one day. No test would ever have caught it, because the bug needs hours of real traffic to show. Render's chart caught it because it’s available by default.
Finding the cause required using the Go debugging toolchain (called pprof) and DuckDB diagnostics. The Go memory profile stayed flat, so the growth was outside Go. duckdb_memory() reports the amount of data DuckDB estimates it is holding, and we narrowed it down by comparing that value against the process's resident memory across five eight-hour soak tests. DuckDB never frees a row deleted from an indexed table once a checkpoint has written it. The leak conditions require both a unique index and scheduled deletes, which is exactly what a SQLFlow tumbling window does.
The fix was to change the window table structure, and the deploy marker on the chart marks the deployment. Memory dropped to about 80 MB and remained stable. That's the feedback loop detailed in the first half of this blog: a hypothesis, a deploy, and a chart to confirm within about two days on a live stream.
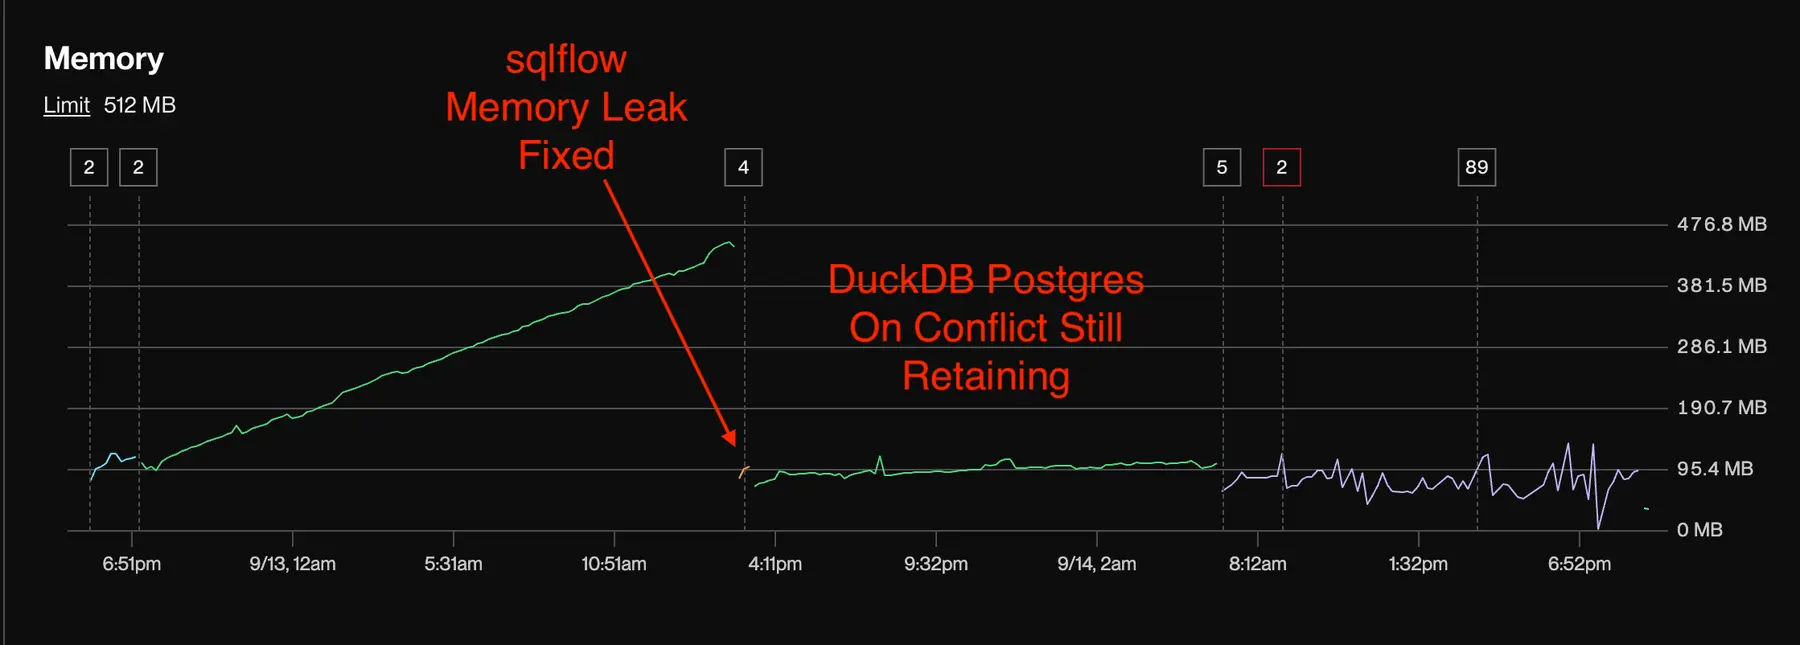
The chart surfaced a second bug the same week. After the fix, the overt memory leak was gone, but memory was still growing incrementally. The DuckDB Postgres extension doesn't send ON CONFLICT to Postgres. It copies the key columns of the entire target table into DuckDB on every upsert, so each write pulls more and more data into the application as the table grows. We filed duckdb-postgres #575 and moved SQLFlow to a native Postgres sink on pgx.
Neither bug was findable by the test suite, and neither needed a data-quality vendor to catch. The on-call signal for a data pipeline is the same signal as for any other service: a memory chart with deploy markers, a health check that restarts a stuck process, and a log you can tail with the Render CLI. This investigation also produced a new test: SQLFlow’s make soak target runs the release image against a live stream and records its memory for 30 minutes before any release.
Fast local feedback finds logic bugs, and production feedback finds long-lived bugs. Both are essential, and the second only works if the pipeline is deployed somewhere that treats it like a service.
Closing the loop: Measuring SQLFlow using SQLFlow
Last week, we shipped a Deploy to Render Blueprint for SQLFlow. One click gives you an HMAC-authenticated webhook for your application to POST events, Postgres to store them, and a query API in front. You POST events and read windowed aggregates back over HTTP. It's enough to take a large volume of application events and serve them straight into a customer-facing dashboard, with nothing in between.
The whole stack is one render.yaml.
We use this exact stack to host the turbolytics.io telemetry server. SQLFlow phones home once on first boot with an anonymous install ID and its version. (You can turn this off with SQLFLOW_TELEMETRY_DISABLED=true.) A webhook POST sends that ping directly to a SQLFlow pipeline running on the same $7 Render instance and Postgres plan.
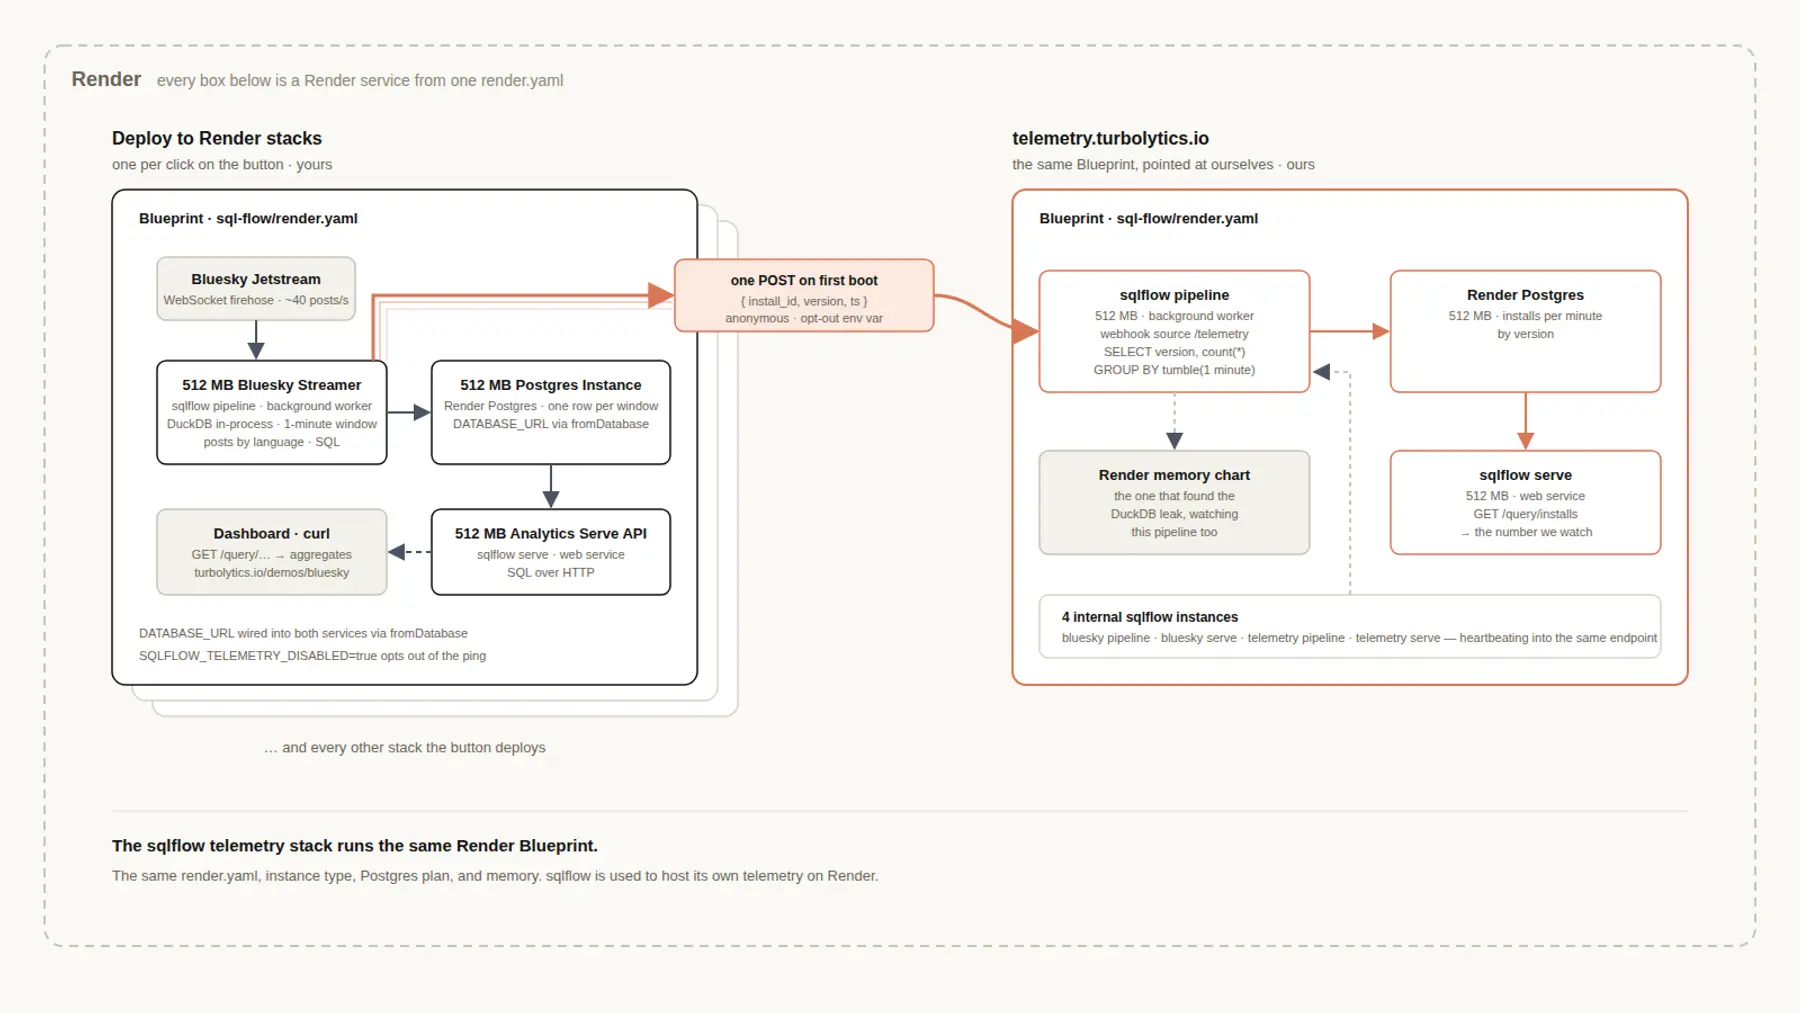
The same stack also measures SQLFlow adoption! When someone clicks the deploy button, their instance boots, sends one HTTP request, and a tumbling window on our side counts it. We track this metric through an SQLFlow query and monitor the underlying pipeline on the same memory chart used to identify the leak. If the launch spikes and the telemetry pipeline falls over, we find out the same way we found out about DuckDB.
Data's DevOps moment
Infrastructure had its DevOps moment when code management and deployment fell directly into the hands of software developers. Data’s time hasn’t come yet. Not because data is inherently harder, but because a pipeline typically involves a cluster that can't live next to your app, with your repo, or in your on-call rotation.
An efficient cloud-native data pipeline operates like any other service: a background worker, a database, a web service, one render.yaml. And once it's a service, you don't need a dedicated data platform to run it. Observability features uncover memory leaks and identify steady state, health checks handle restarts, and CI gates deploys.
None of this was built for data. The cloud, the release pipeline, and the observability were established best practices for nearly 20 years. What changed is the data tool. A 32 GB JVM cluster can't live on a $7 instance, so it lives on its own platform with its own operators. A pipeline that fits in 256 MB can. Data's DevOps moment doesn’t require new infrastructure. It's data tools finally built to run on the infrastructure everyone else already has.
Deploy SQLFlow on Render here.. To see it in action, visit the live demo site and dive into the source code.